やりたいこと
- yfinanceの使い方
- ローソクチャートの作成
- 移動平均の計算とグラフへの記載
参考URL
- yfinanceを使って株価データや財務情報を取得する方法 - データテックログ
- yfinance · PyPI
- Pythonで株の情報を取得したい - リラックスした生活を過ごすために
- 【Python】Yahoo!financeのデータでローソク足を作成してみよう - ジェイの投資ライフ
yfinanceを利用した株価取得
yfinanceのインストール
Python環境コマンドラインにて以下を実行。
pip install yfinance
yfinanceを使った株価情報の取得(1976:明星工)
import yfinance as yf

# 明星工の情報を取得
ticker_info = yf.Ticker("1976.T")

# 株価データ(日毎)を取得(DataFrame形式)
hist = ticker_info.history(period="max")

# 取得データの表示
hist
結果
	Open	High	Low	Close	Volume	Dividends	Stock Splits
Date
2000-04-04 00:00:00+09:00	96.852356	96.852356	95.586312	96.852356	22000	0.0	0.0
2000-04-05 00:00:00+09:00	96.852356	96.852356	96.852356	96.852356	3000	0.0	0.0
2000-04-06 00:00:00+09:00	98.118408	98.118408	98.118408	98.118408	6000	0.0	0.0
2000-04-07 00:00:00+09:00	98.118408	98.751430	98.118408	98.118408	3000	0.0	0.0
2000-04-10 00:00:00+09:00	98.751427	98.751427	98.751427	98.751427	18000	0.0	0.0
...	...	...	...	...	...	...	...
2023-09-21 00:00:00+09:00	1015.000000	1038.000000	1015.000000	1030.000000	57100	0.0	0.0
2023-09-22 00:00:00+09:00	1017.000000	1031.000000	1012.000000	1024.000000	86400	0.0	0.0
2023-09-25 00:00:00+09:00	1035.000000	1035.000000	1020.000000	1026.000000	66300	0.0	0.0
2023-09-26 00:00:00+09:00	1022.000000	1030.000000	1015.000000	1025.000000	66100	0.0	0.0
2023-09-27 00:00:00+09:00	1022.000000	1046.000000	1015.000000	1045.000000	96500	0.0	0.0
5874 rows × 7 columns
取得時の条件指定方法
import yfinance as yf

# 明星工の情報を取得
stock_code = "1976.T"

# 期間を指定して情報を取得する
start = '2023-08-01'
end = '2023-09-26'
hist1 = yf.download(tickers=stock_code, start=start, end=end)
print("********2023/8/1から9/26の株情報(日毎)********")
print(hist1)

# 直近1日の分足情報を取得する
# 取得期間の設定:period→1d,5d,1mo,3mo,6mo,1y,2y,5y,10y,ytd,max
# 取得間隔の指定:interval→1m,2m,5m,15m,30m,60m,90m,1h,1d,5d,1wk,1mo,3mo
hist2 = yf.download(tickers=stock_code, period='1d', interval='1m')
print("********直近一日の株情報(分毎)********")
print(hist2)
結果
[*********************100%%**********************]  1 of 1 completed
********2023/8/1から9/26の株情報(日毎)********
              Open    High     Low   Close  Adj Close  Volume
Date
2023-08-01   949.0   956.0   936.0   949.0      949.0  184300
2023-08-02   939.0   951.0   931.0   937.0      937.0  160300
2023-08-03   933.0   933.0   912.0   917.0      917.0  194800
2023-08-04   913.0   920.0   910.0   916.0      916.0  119500
2023-08-07   916.0   922.0   914.0   918.0      918.0   49500
2023-08-08   923.0   927.0   906.0   907.0      907.0   63000
2023-08-09   909.0   910.0   898.0   906.0      906.0   68100
2023-08-10   907.0   928.0   903.0   928.0      928.0   94800
2023-08-14   929.0   935.0   923.0   927.0      927.0   66900
2023-08-15   928.0   933.0   925.0   933.0      933.0   69000
2023-08-16   931.0   938.0   929.0   935.0      935.0   50000
2023-08-17   936.0   939.0   923.0   936.0      936.0  196400
2023-08-18   931.0   936.0   907.0   912.0      912.0   84200
2023-08-21   920.0   922.0   915.0   917.0      917.0   52700
2023-08-22   917.0   924.0   911.0   922.0      922.0  116400
2023-08-23   922.0   926.0   917.0   924.0      924.0   34500
2023-08-24   922.0   932.0   922.0   930.0      930.0   50600
2023-08-25   924.0   930.0   921.0   925.0      925.0   86200
2023-08-28   934.0   953.0   933.0   950.0      950.0  125500
2023-08-29   951.0   954.0   941.0   943.0      943.0   88800
2023-08-30   947.0   954.0   944.0   951.0      951.0  118700
2023-08-31   955.0   965.0   953.0   959.0      959.0  131100
2023-09-01   964.0   978.0   963.0   974.0      974.0   77500
2023-09-04   975.0   994.0   975.0   993.0      993.0   99500
2023-09-05   993.0   996.0   988.0   996.0      996.0   93100
2023-09-06   996.0  1008.0   995.0  1006.0     1006.0   96600
2023-09-07   999.0  1014.0   999.0  1007.0     1007.0  109800
2023-09-08  1001.0  1003.0   980.0   981.0      981.0  176200
2023-09-11   985.0   985.0   973.0   975.0      975.0   88200
2023-09-12   983.0   992.0   974.0   990.0      990.0   69500
2023-09-13   987.0   993.0   983.0   991.0      991.0  129400
2023-09-14   986.0  1009.0   984.0  1006.0     1006.0   88600
2023-09-15  1020.0  1067.0  1019.0  1061.0     1061.0  198800
2023-09-19  1060.0  1062.0  1043.0  1062.0     1062.0  100700
2023-09-20  1062.0  1062.0  1027.0  1031.0     1031.0   98500
2023-09-21  1015.0  1038.0  1015.0  1030.0     1030.0   57100
2023-09-22  1017.0  1031.0  1012.0  1024.0     1024.0   86400
2023-09-25  1035.0  1035.0  1020.0  1026.0     1026.0   66300
[*********************100%%**********************]  1 of 1 completed
********直近一日の株情報(分毎)********
                             Open    High     Low   Close  Adj Close  Volume
Datetime
2023-09-27 09:00:00+09:00  1022.0  1022.0  1020.0  1020.0     1020.0       0
2023-09-27 09:03:00+09:00  1016.0  1016.0  1015.0  1015.0     1015.0    1000
2023-09-27 09:04:00+09:00  1017.0  1017.0  1017.0  1017.0     1017.0     100
2023-09-27 09:05:00+09:00  1015.0  1015.0  1015.0  1015.0     1015.0     200
2023-09-27 09:06:00+09:00  1016.0  1016.0  1016.0  1016.0     1016.0     100
...                           ...     ...     ...     ...        ...     ...
2023-09-27 14:54:00+09:00  1042.0  1042.0  1042.0  1042.0     1042.0     400
2023-09-27 14:55:00+09:00  1043.0  1043.0  1043.0  1043.0     1043.0     600
2023-09-27 14:57:00+09:00  1044.0  1044.0  1043.0  1043.0     1043.0     500
2023-09-27 14:58:00+09:00  1043.0  1043.0  1042.0  1042.0     1042.0     900
2023-09-27 14:59:00+09:00  1044.0  1046.0  1043.0  1043.0     1043.0    4900

[137 rows x 6 columns]
yfinanceを使った企業情報の取得(1976:明星工)
# 明星工の情報を取得
stock_code = "1976.T"

# 指定した証券コードの企業情報を取得(JSON形式)
ticker_info = yf.Ticker(stock_code)

# 取得した情報の出力
# バランスシート
print("********バランスシート********")
print(ticker_info.balancesheet)

# キャッシュフロー
print("********キャッシュフロー********")
print(ticker_info.cashflow)

# 財務
print("********財務********")
print(ticker_info.financials)

# 配当
print("********配当********")
print(ticker_info.dividends)
結果
********バランスシート********
2023-03-31 \
Treasury Shares Number 6587371.0
Ordinary Shares Number 49799347.0
Share Issued 56386718.0
Total Debt 800000000.0
Tangible Book Value 58991000000.0
... ...
Other Receivables 6009000000.0
Accounts Receivable 16275000000.0
Cash Cash Equivalents And Short Term Investments 29317000000.0
Other Short Term Investments 300000000.0
Cash And Cash Equivalents 29017000000.0
2022-03-31 \
Treasury Shares Number 6614632.0
Ordinary Shares Number 49772086.0
Share Issued 56386718.0
Total Debt 960000000.0
Tangible Book Value 55487000000.0
... ...
Other Receivables 4011000000.0
Accounts Receivable 15354000000.0
Cash Cash Equivalents And Short Term Investments 27492000000.0
Other Short Term Investments 300000000.0
Cash And Cash Equivalents 27192000000.0
2021-03-31 2020-03-31
Treasury Shares Number 8114323.0 8121256.0
Ordinary Shares Number 51272395.0 51265462.0
Share Issued 59386718.0 59386718.0
Total Debt 1020000000.0 960000000.0
Tangible Book Value 53911000000.0 50371000000.0
... ... ...
Other Receivables 2173000000.0 1351000000.0
Accounts Receivable 18288000000.0 18864000000.0
Cash Cash Equivalents And Short Term Investments 22884000000.0 19691000000.0
Other Short Term Investments 400000000.0 300000000.0
Cash And Cash Equivalents 22484000000.0 19391000000.0
[64 rows x 4 columns]
********キャッシュフロー********
2023-03-31 2022-03-31 \
Free Cash Flow 3133000000.0 6920000000.0
Repurchase Of Capital Stock 0.0 -1128000000.0
Repayment Of Debt -960000000.0 -60000000.0
Issuance Of Debt 800000000.0 0.0
Issuance Of Capital Stock 5000000.0 74000000.0
Capital Expenditure -935000000.0 -251000000.0
End Cash Position 29004000000.0 27183000000.0
Other Cash Adjustment Outside Changein Cash NaN NaN
Beginning Cash Position 27183000000.0 22471000000.0
Effect Of Exchange Rate Changes 319000000.0 211000000.0
Changes In Cash 1502000000.0 4501000000.0
Financing Cash Flow -1739000000.0 -2661000000.0
Net Other Financing Charges 16000000.0 NaN
Cash Dividends Paid -1600000000.0 -1542000000.0
Common Stock Dividend Paid NaN NaN
Net Common Stock Issuance 5000000.0 -1054000000.0
Common Stock Payments 0.0 -1128000000.0
Common Stock Issuance 5000000.0 74000000.0
Net Issuance Payments Of Debt -160000000.0 -60000000.0
Net Long Term Debt Issuance -160000000.0 -60000000.0
Long Term Debt Payments -960000000.0 -60000000.0
Long Term Debt Issuance 800000000.0 0.0
Investing Cash Flow -827000000.0 -9000000.0
Net Other Investing Changes 19000000.0 287000000.0
Dividends Received Cfi 77000000.0 62000000.0
Net Investment Purchase And Sale 12000000.0 -107000000.0
Sale Of Investment 461000000.0 507000000.0
Purchase Of Investment -449000000.0 -614000000.0
Net PPE Purchase And Sale -935000000.0 -251000000.0
Purchase Of PPE -935000000.0 -251000000.0
Operating Cash Flow 4068000000.0 7171000000.0
Taxes Refund Paid -1764000000.0 -2178000000.0
Interest Received Cfo 144000000.0 116000000.0
Interest Paid Cfo -4000000.0 -4000000.0
Change In Working Capital -2041000000.0 3259000000.0
Change In Other Current Liabilities NaN NaN
Change In Other Current Assets -61000000.0 640000000.0
Change In Payable 2076000000.0 513000000.0
Change In Inventory -70000000.0 430000000.0
Change In Receivables -3869000000.0 1706000000.0
Other Non Cash Items 87000000.0 -267000000.0
Depreciation And Amortization 568000000.0 761000000.0
Depreciation 568000000.0 761000000.0
Gain Loss On Investment Securities -148000000.0 -115000000.0
Net Foreign Currency Exchange Gain Loss -30000000.0 -45000000.0
Net Income From Continuing Operations 6901000000.0 5641000000.0
2021-03-31 2020-03-31
Free Cash Flow 4377000000.0 404000000.0
Repurchase Of Capital Stock 0.0 -800000000.0
Repayment Of Debt -740000000.0 -310000000.0
Issuance Of Debt 800000000.0 250000000.0
Issuance Of Capital Stock 6000000.0 35000000.0
Capital Expenditure -788000000.0 -511000000.0
End Cash Position 22471000000.0 19381000000.0
Other Cash Adjustment Outside Changein Cash -2000000.0 2000000.0
Beginning Cash Position 19381000000.0 20642000000.0
Effect Of Exchange Rate Changes -72000000.0 -2000000.0
Changes In Cash 3164000000.0 -1261000000.0
Financing Cash Flow -1469000000.0 -2376000000.0
Net Other Financing Charges 14000000.0 12000000.0
Cash Dividends Paid -1541000000.0 -1563000000.0
Common Stock Dividend Paid NaN -1563000000.0
Net Common Stock Issuance 6000000.0 -765000000.0
Common Stock Payments 0.0 -800000000.0
Common Stock Issuance 6000000.0 35000000.0
Net Issuance Payments Of Debt 60000000.0 -60000000.0
Net Long Term Debt Issuance 60000000.0 -60000000.0
Long Term Debt Payments -740000000.0 -310000000.0
Long Term Debt Issuance 800000000.0 250000000.0
Investing Cash Flow -532000000.0 200000000.0
Net Other Investing Changes 281000000.0 292000000.0
Dividends Received Cfi 183000000.0 223000000.0
Net Investment Purchase And Sale -208000000.0 196000000.0
Sale Of Investment 407000000.0 863000000.0
Purchase Of Investment -615000000.0 -667000000.0
Net PPE Purchase And Sale -788000000.0 -511000000.0
Purchase Of PPE -788000000.0 -511000000.0
Operating Cash Flow 5165000000.0 915000000.0
Taxes Refund Paid -1978000000.0 -2469000000.0
Interest Received Cfo 121000000.0 150000000.0
Interest Paid Cfo -4000000.0 -5000000.0
Change In Working Capital -490000000.0 -2762000000.0
Change In Other Current Liabilities -76000000.0 -70000000.0
Change In Other Current Assets 428000000.0 -1229000000.0
Change In Payable -1792000000.0 119000000.0
Change In Inventory 62000000.0 -373000000.0
Change In Receivables 788000000.0 -1155000000.0
Other Non Cash Items 85000000.0 -1345000000.0
Depreciation And Amortization 810000000.0 481000000.0
Depreciation 810000000.0 481000000.0
Gain Loss On Investment Securities -121000000.0 -143000000.0
Net Foreign Currency Exchange Gain Loss -1000000.0 13000000.0
Net Income From Continuing Operations 6742000000.0 6996000000.0
********財務********
2023-03-31 \
Tax Effect Of Unusual Items -100328937.835096
Tax Rate For Calcs 0.319519
Normalized EBITDA 7787000000.0
Total Unusual Items -314000000.0
Total Unusual Items Excluding Goodwill -314000000.0
Net Income From Continuing Operation Net Minori... 4680000000.0
Reconciled Depreciation 568000000.0
Reconciled Cost Of Revenue 44309000000.0
EBITDA 7473000000.0
EBIT 6905000000.0
Net Interest Income 30000000.0
Interest Expense 4000000.0
Interest Income 34000000.0
Normalized Income 4893671062.164904
Net Income From Continuing And Discontinued Ope... 4680000000.0
Total Expenses 49059000000.0
Total Operating Income As Reported 6830000000.0
Diluted Average Shares 49789000.0
Basic Average Shares 49789000.0
Diluted EPS 94.0
Basic EPS 94.0
Diluted NI Availto Com Stockholders 4680000000.0
Net Income Common Stockholders 4680000000.0
Otherunder Preferred Stock Dividend 0.0
Net Income 4680000000.0
Minority Interests -16000000.0
Net Income Including Noncontrolling Interests 4696000000.0
Net Income Continuous Operations 4696000000.0
Tax Provision 2205000000.0
Pretax Income 6901000000.0
Other Non Operating Income Expenses 173000000.0
Special Income Charges -352000000.0
Other Special Charges NaN
Write Off 352000000.0
Net Non Operating Interest Income Expense 30000000.0
Interest Expense Non Operating 4000000.0
Interest Income Non Operating 34000000.0
Operating Income 6831000000.0
Operating Expense 4750000000.0
Gross Profit 11581000000.0
Cost Of Revenue 44309000000.0
Total Revenue 55890000000.0
Operating Revenue 55890000000.0
2022-03-31 \
Tax Effect Of Unusual Items 8502000.0
Tax Rate For Calcs 0.327
Normalized EBITDA 6380000000.0
Total Unusual Items 26000000.0
Total Unusual Items Excluding Goodwill 26000000.0
Net Income From Continuing Operation Net Minori... 3793000000.0
Reconciled Depreciation 761000000.0
Reconciled Cost Of Revenue 38464000000.0
EBITDA 6406000000.0
EBIT 5645000000.0
Net Interest Income 11000000.0
Interest Expense 4000000.0
Interest Income 15000000.0
Normalized Income 3775502000.0
Net Income From Continuing And Discontinued Ope... 3793000000.0
Total Expenses 43049000000.0
Total Operating Income As Reported 5339000000.0
Diluted Average Shares 50838000.0
Basic Average Shares 50838000.0
Diluted EPS 74.63
Basic EPS 74.63
Diluted NI Availto Com Stockholders 3793000000.0
Net Income Common Stockholders 3793000000.0
Otherunder Preferred Stock Dividend 0.0
Net Income 3793000000.0
Minority Interests -1000000.0
Net Income Including Noncontrolling Interests 3795000000.0
Net Income Continuous Operations 3795000000.0
Tax Provision 1846000000.0
Pretax Income 5641000000.0
Other Non Operating Income Expenses 131000000.0
Special Income Charges -36000000.0
Other Special Charges 40000000.0
Write Off -4000000.0
Net Non Operating Interest Income Expense 11000000.0
Interest Expense Non Operating 4000000.0
Interest Income Non Operating 15000000.0
Operating Income 5340000000.0
Operating Expense 4585000000.0
Gross Profit 9925000000.0
Cost Of Revenue 38464000000.0
Total Revenue 48389000000.0
Operating Revenue 48389000000.0
2021-03-31 \
Tax Effect Of Unusual Items 32149213.883121
Tax Rate For Calcs 0.315188
Normalized EBITDA 7454000000.0
Total Unusual Items 102000000.0
Total Unusual Items Excluding Goodwill 102000000.0
Net Income From Continuing Operation Net Minori... 4600000000.0
Reconciled Depreciation 810000000.0
Reconciled Cost Of Revenue 39633000000.0
EBITDA 7556000000.0
EBIT 6746000000.0
Net Interest Income 20000000.0
Interest Expense 4000000.0
Interest Income 24000000.0
Normalized Income 4530149213.883121
Net Income From Continuing And Discontinued Ope... 4600000000.0
Total Expenses 44133000000.0
Total Operating Income As Reported 6399000000.0
Diluted Average Shares 51270000.0
Basic Average Shares 51270000.0
Diluted EPS 89.74
Basic EPS 89.74
Diluted NI Availto Com Stockholders 4600000000.0
Net Income Common Stockholders 4600000000.0
Otherunder Preferred Stock Dividend 0.0
Net Income 4600000000.0
Minority Interests -16000000.0
Net Income Including Noncontrolling Interests 4617000000.0
Net Income Continuous Operations 4617000000.0
Tax Provision 2125000000.0
Pretax Income 6742000000.0
Other Non Operating Income Expenses 187000000.0
Special Income Charges 27000000.0
Other Special Charges NaN
Write Off -27000000.0
Net Non Operating Interest Income Expense 20000000.0
Interest Expense Non Operating 4000000.0
Interest Income Non Operating 24000000.0
Operating Income 6400000000.0
Operating Expense 4500000000.0
Gross Profit 10900000000.0
Cost Of Revenue 39633000000.0
Total Revenue 50533000000.0
Operating Revenue 50533000000.0
2020-03-31
Tax Effect Of Unusual Items 62016000.0
Tax Rate For Calcs 0.323
Normalized EBITDA 7290000000.0
Total Unusual Items 192000000.0
Total Unusual Items Excluding Goodwill 192000000.0
Net Income From Continuing Operation Net Minori... 4709000000.0
Reconciled Depreciation 481000000.0
Reconciled Cost Of Revenue 42016000000.0
EBITDA 7482000000.0
EBIT 7001000000.0
Net Interest Income 46000000.0
Interest Expense 5000000.0
Interest Income 51000000.0
Normalized Income 4579016000.0
Net Income From Continuing And Discontinued Ope... 4709000000.0
Total Expenses 46630000000.0
Total Operating Income As Reported 6442000000.0
Diluted Average Shares 51754000.0
Basic Average Shares 51754000.0
Diluted EPS 91.0
Basic EPS 91.0
Diluted NI Availto Com Stockholders 4709000000.0
Net Income Common Stockholders 4709000000.0
Otherunder Preferred Stock Dividend 0.0
Net Income 4709000000.0
Minority Interests -28000000.0
Net Income Including Noncontrolling Interests 4738000000.0
Net Income Continuous Operations 4739000000.0
Tax Provision 2257000000.0
Pretax Income 6996000000.0
Other Non Operating Income Expenses 216000000.0
Special Income Charges 31000000.0
Other Special Charges 20000000.0
Write Off -51000000.0
Net Non Operating Interest Income Expense 46000000.0
Interest Expense Non Operating 5000000.0
Interest Income Non Operating 51000000.0
Operating Income 6443000000.0
Operating Expense 4614000000.0
Gross Profit 11057000000.0
Cost Of Revenue 42016000000.0
Total Revenue 53073000000.0
Operating Revenue 53073000000.0
********配当********
Date
2002-03-26 00:00:00+09:00 2.5
2004-03-26 00:00:00+09:00 2.5
2007-03-27 00:00:00+09:00 3.0
2007-09-25 00:00:00+09:00 3.0
2008-03-26 00:00:00+09:00 3.0
2008-09-25 00:00:00+09:00 3.0
2009-03-26 00:00:00+09:00 3.0
2009-09-25 00:00:00+09:00 3.0
2010-03-29 00:00:00+09:00 3.0
2010-09-28 00:00:00+09:00 3.0
2011-03-29 00:00:00+09:00 3.0
2011-09-28 00:00:00+09:00 3.0
2012-03-28 00:00:00+09:00 3.0
2012-09-26 00:00:00+09:00 3.0
2013-03-27 00:00:00+09:00 3.0
2013-09-26 00:00:00+09:00 3.0
2014-03-27 00:00:00+09:00 2.0
2014-09-26 00:00:00+09:00 4.0
2015-03-27 00:00:00+09:00 4.0
2015-09-28 00:00:00+09:00 5.0
2016-03-29 00:00:00+09:00 5.0
2016-09-28 00:00:00+09:00 6.0
2017-03-29 00:00:00+09:00 8.0
2017-09-27 00:00:00+09:00 8.0
2018-03-28 00:00:00+09:00 18.0
2018-09-26 00:00:00+09:00 10.0
2019-03-27 00:00:00+09:00 20.0
2019-09-27 00:00:00+09:00 10.0
2020-03-30 00:00:00+09:00 20.0
2020-09-29 00:00:00+09:00 10.0
2021-03-30 00:00:00+09:00 12.0
2021-09-29 00:00:00+09:00 10.0
2022-03-30 00:00:00+09:00 20.0
2022-09-29 00:00:00+09:00 12.0
2023-03-30 00:00:00+09:00 24.0
Name: Dividends, dtype: float64
- DataFrame形式で株取引情報が取得できる
- 株価は分足、日足、週足、月足が指定可能
- JSON形式で会社情報の取得ができる
mplfinanceを利用したグラフ表示
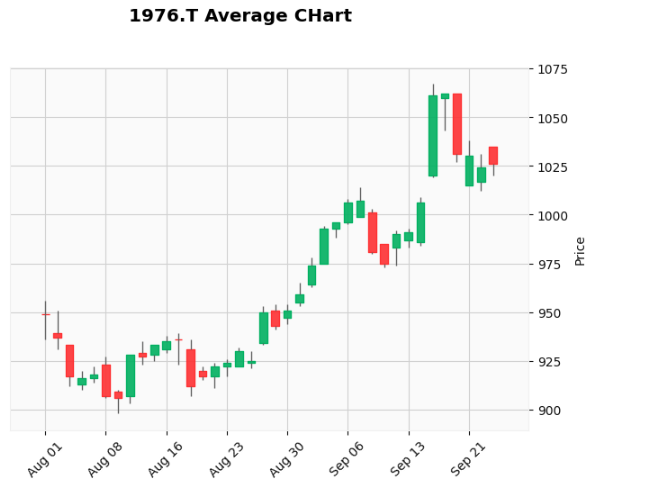
#### ローソク足チャートの表示
import matplotlib.pyplot as plt
import yfinance
import mplfinance as mf

#データの取得(明星工:1976.T)
stock_code = "1976.T"
start = '2023-08-01'
end = '2023-09-26'
hist = yf.download(tickers=stock_code, start=start, end=end, interval='1d', auto_adjust=True)
# auto_adjust:『始値 / 高値 / 安値 / 終値』の四本値を自動的に調整する

#グラフの表示
chart = mf.plot(hist,style='yahoo',type='candle',title='1976.T Average CHart')
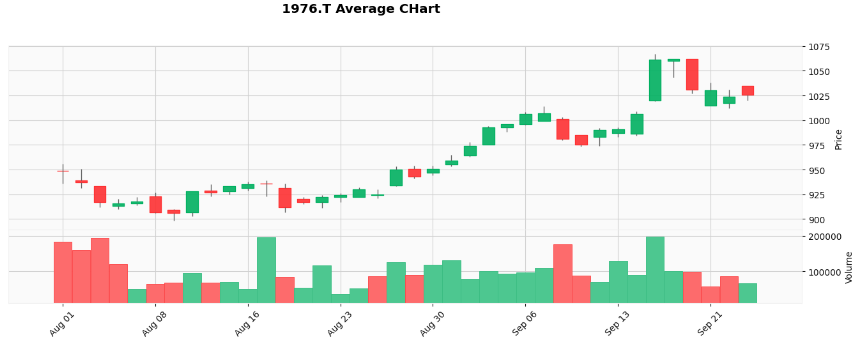
チャートの表示サイズを変更、出来高(ボリューム)表示
import matplotlib.pyplot as plt
import yfinance
import mplfinance as mf

#データの取得(明星工:1976.T)
stock_code = "1976.T"
start = '2023-08-01'
end = '2023-09-26'
hist = yf.download(tickers=stock_code, start=start, end=end, interval='1d', auto_adjust=True)

#グラフの表示
chart = mf.plot(hist,style='yahoo',type='candle',title='1976.T Average CHart',
               figratio=(12,4), #縦横のサイズ指定
               volume=True) #出来高(ボリューム)を表示
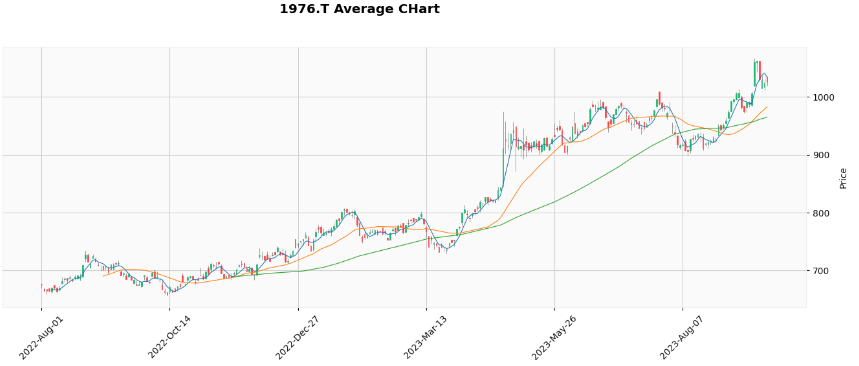
取得したデータで移動平均を計算する
mplfinanceを使ってグラフに移動平均線を追加する
import matplotlib.pyplot as plt
import yfinance
import mplfinance as mf

#データの取得(明星工:1976.T)
stock_code = "1976.T"
start = '2022-08-01'
end = '2023-09-26'
hist = yf.download(tickers=stock_code, start=start, end=end, interval='1d', auto_adjust=True)

#グラフの表示
chart = mf.plot(hist,style='yahoo',type='candle',title='1976.T Average CHart', figratio=(12,4),
               mav=(5,25,75))
移動平均を計算する(DataFrame型)
import yfinance
from datetime import datetime, timedelta, timezone

#データの取得(明星工:1976.T)
stock_code = "1976.T"
start = '2022-08-01'
end = '2023-09-26'
stock = yf.download(tickers=stock_code, start=start, end=end, interval='1d')

# 列を追加し、平均を計算する
stock['5ma'] = stock['Adj Close'].rolling(window=5).mean()
stock['25ma'] = stock['Adj Close'].rolling(window=25).mean()
stock['75ma'] = stock['Adj Close'].rolling(window=75).mean()

# 結果を表示
stock
結果
	Open	High	Low	Close	Adj Close	Volume	5ma	25ma	75ma
Date
2022-08-01	710.0	710.0	703.0	708.0	674.555725	70600	NaN	NaN	NaN
2022-08-02	700.0	702.0	696.0	696.0	663.122620	100300	NaN	NaN	NaN
2022-08-03	700.0	700.0	691.0	696.0	663.122620	56000	NaN	NaN	NaN
2022-08-04	701.0	701.0	695.0	696.0	663.122620	42800	NaN	NaN	NaN
2022-08-05	695.0	704.0	692.0	702.0	668.839172	59900	666.552551	NaN	NaN
...	...	...	...	...	...	...	...	...	...
2023-09-19	1060.0	1062.0	1043.0	1062.0	1062.000000	100700	1022.000000	967.16	959.693333
2023-09-20	1062.0	1062.0	1027.0	1031.0	1031.000000	98500	1030.200000	971.08	961.240000
2023-09-21	1015.0	1038.0	1015.0	1030.0	1030.000000	57100	1038.000000	974.88	962.613333
2023-09-22	1017.0	1031.0	1012.0	1024.0	1024.000000	86400	1041.600000	978.40	963.613333
2023-09-25	1035.0	1035.0	1020.0	1026.0	1026.000000	66300	1034.600000	982.96	964.813333
284 rows × 9 columns
移動平均の値が途切れないようにする
import pandas as pd
import yfinance
import mplfinance as mf
from datetime import datetime, timedelta, timezone

#データの取得(明星工:1976.T)
stock_code = "1976.T"
start = '2021-08-01' #移動平均の計算をするために描画する期間よりも前からデータを取得しておく
end = '2023-09-26'
stock = yf.download(tickers=stock_code, start=start, end=end, interval='1d')

# 列を追加し、平均を計算する
stock['5ma'] = stock['Adj Close'].rolling(window=5).mean()
stock['25ma'] = stock['Adj Close'].rolling(window=25).mean()
stock['75ma'] = stock['Adj Close'].rolling(window=75).mean()

# 実際に使いたい期間だけにする
stock=stock[stock.index > datetime(2022,8,1)]

stock
結果
	Open	High	Low	Close	Adj Close	Volume	5ma	25ma	75ma
Date
2022-08-02	700.0	702.0	696.0	696.0	663.122620	100300	675.508508	671.964233	669.410833
2022-08-03	700.0	700.0	691.0	696.0	663.122620	56000	671.316357	671.735571	669.690310
2022-08-04	701.0	701.0	695.0	696.0	663.122620	42800	668.076978	671.468796	669.817345
2022-08-05	695.0	704.0	692.0	702.0	668.839172	59900	666.552551	671.392576	670.109526
2022-08-08	707.0	707.0	700.0	702.0	668.839172	31700	665.409241	671.659351	670.439817
...	...	...	...	...	...	...	...	...	...
2023-09-19	1060.0	1062.0	1043.0	1062.0	1062.000000	100700	1022.000000	967.160000	959.693333
2023-09-20	1062.0	1062.0	1027.0	1031.0	1031.000000	98500	1030.200000	971.080000	961.240000
2023-09-21	1015.0	1038.0	1015.0	1030.0	1030.000000	57100	1038.000000	974.880000	962.613333
2023-09-22	1017.0	1031.0	1012.0	1024.0	1024.000000	86400	1041.600000	978.400000	963.613333
2023-09-25	1035.0	1035.0	1020.0	1026.0	1026.000000	66300	1034.600000	982.960000	964.813333
283 rows × 9 columns
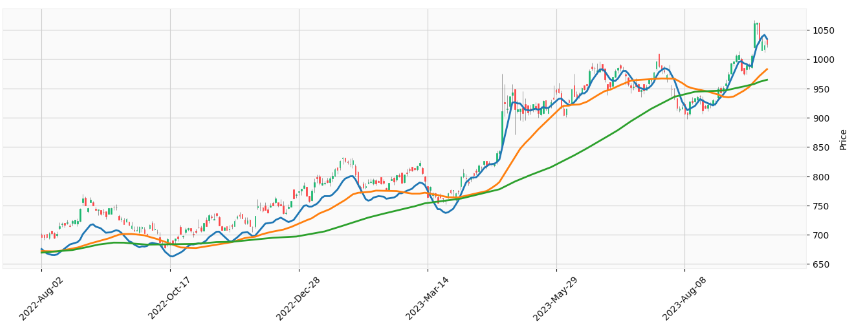
グラフで表示
import pandas as pd
import yfinance
import mplfinance as mf
from datetime import datetime, timedelta, timezone

#データの取得(明星工:1976.T)
stock_code = "1976.T"
start = '2021-08-01' #移動平均の計算をするために描画する期間よりも前からデータを取得しておく
end = '2023-09-26'
stock = yf.download(tickers=stock_code, start=start, end=end, interval='1d')

stock['5ma'] = stock['Adj Close'].rolling(window=5).mean()
stock['25ma'] = stock['Adj Close'].rolling(window=25).mean()
stock['75ma'] = stock['Adj Close'].rolling(window=75).mean()

stock=stock[stock.index > datetime(2022,8,1)]

# グラフ表示
addplot_ma = mf.make_addplot(stock[['5ma','25ma','75ma']],width=2)
mf.plot(stock, style='yahoo', type='candle', addplot = addplot_ma, figratio=(12,4), )
~とりあえず今日はここまで~
- DataFrameの行を条件で抽出(移動平均の5と25が同値になったタイミングを抽出)
- (参照)pandas.DataFrameの行を条件で抽出するquery _ note.nkmk.me