はじめに
決定木は、説明可能性が高く有用な手法なのですが、pythonにおいては可視化がいまいちなため、選択肢に入りにくくなっていたと個人的に思います。
そんな中、dtreevizというライブラリが公開され、綺麗に可視化できるようになったよ!って話。
python決定木可視化のBefore/After
先にどのように変わったのかを示した方が分かりやすいので、irisデータを使った決定木の例。
決定木を学習
from sklearn.datasets import load_iris
from sklearn import tree

clf = tree.DecisionTreeClassifier(max_depth=2)  # limit depth of tree
iris = load_iris()
clf.fit(iris.data, iris.target)
Before
おそらくメジャーなgraphvizでの可視化
graphvizによる決定木可視化
import pydotplus
from IPython.display import Image
from graphviz import Digraph

dot_data = tree.export_graphviz(
    clf,
    out_file=None,
    feature_names=iris.feature_names,
    class_names=iris.target_names,
    filled=True,
    proportion=True)
graph = pydotplus.graph_from_dot_data(dot_data)
Image(graph.create_png())

After
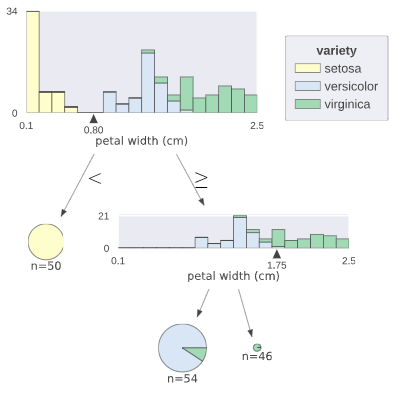
dtreevizだとこんな感じ
dtreevizによる可視化
from dtreeviz.trees import dtreeviz

viz = dtreeviz(
    clf,
    iris.data,
    iris.target,
    target_name='variety',
    feature_names=iris.feature_names,
    class_names=[str(i) for i in iris.target_names],
)

viz.view()
dtreevizで変わったところ
-
とにかくデザインがオシャレになった
-
このまま説明資料に使えそう
-
分類に使用される特徴量の分布と決定境界が示されるようになった
-
葉の詳細な純度が落ちた代わりに、円グラフによる構成比で分かりやすくなった
-
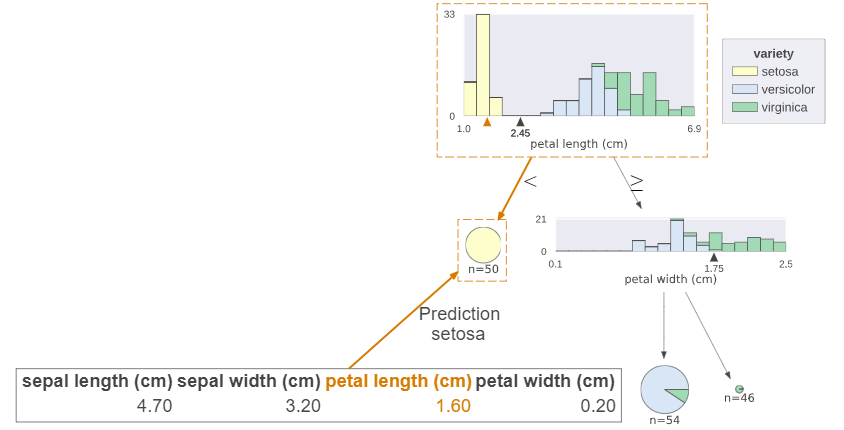
サンプルデータを与えると、推論の過程と根拠となる特徴量を表示することができる
決定木推論過程の可視化
X = iris.data[29]  # サンプルデータ

viz = dtreeviz(
    classifier,
    iris.data,
    iris.target,
    target_name='variety',
    feature_names=iris.feature_names,
    class_names=[str(i) for i in iris.target_names],
    X=X, # サンプルデータを与えると、分類の過程が表示される
)

viz.view()
ちなみに、ここまでは分類木の例だけでしたが、回帰木の可視化もできます。
(ただ回帰木を積極的に使う機会はあまりないですね・・・。)
dtreeviz関数の引数
| 引数 | 型 | デフォルト値 | 説明 |
|---|---|---|---|
| tree_model | sklearnのDecisionTreeRegressorかDecisionTreeClassifier | ||
| X_train | (pd.DataFrame, np.ndarray) | モデル訓練に使用した説明変数データ | |
| y_train | (pd.Series, np.ndarray) | モデル訓練に使用した目的変数データ | |
| feature_names | List[str] | X_trainの各特徴量名 | |
| target_name | str | 目的変数の名前 | |
| class_names | (Mapping[Number, str], List[str]) | (分類木の時必須)各クラスに対応する名前 | |
| precision | int | 2 | 特徴量の境界値を表示する小数点以下の桁数 |
| orientation | ('TD', 'LR') | 'TD' | 木が分岐する方向 TD: top-down or LR: left-right |
| show_root_edge_labels | bool | True | ルートからノードへの分岐の値関係を表示するか |
| show_node_labels | bool | False | ノード番号を表示するか |
| fancy | bool | True | 特徴量の決定境界を可視化するか |
| histtype | ('bar', 'barstacked') | 'barstacked' | 分類木の時、ヒストグラムの表示形式 |
| X | np.ndarray | None | 推論過程を可視化するサンプルデータ |
| max_X_features_LR | int | 10 | orientation='LR'の時、表示するサンプルデータの特徴量数 |
| max_X_features_TD | int | 20 | orientation='TD'の時、表示するサンプルデータの特徴量数 |
注意
jupyter labやgoogle colabの場合は、viewが使えないようなので、display(viz)で可視化してあげる必要があります。

