tl;dr
import pandas as pd
import mlflow

def get_metric_history(run_id, metric):
    client = mlflow.tracking.MlflowClient()
    history = client.get_metric_history(run_id, metric)
    history = [dict(key=m.key, value=m.value, timestamp=m.timestamp, step=m.step) for m in history]
    history = pd.DataFrame(history).sort_values("step")
    history.timestamp = pd.to_datetime(history.timestamp, unit="ms")
    return history

train_loss = get_metric_history(run_id, "train_loss")
valid_loss = get_metric_history(run_id, "valid_loss")
history = pd.concat((train_loss, valid_loss))
history.pivot(index="step", columns="key", values="value").plot()
How to
MLFlowでサーバーとやり取りしたいときは、 mlflow.tracking.MlflowClient を使います。
MlflowClient.get_metric_history(run_id, key) を使うとあるrunでのあるkeyのmetricの履歴がすべて取れます。
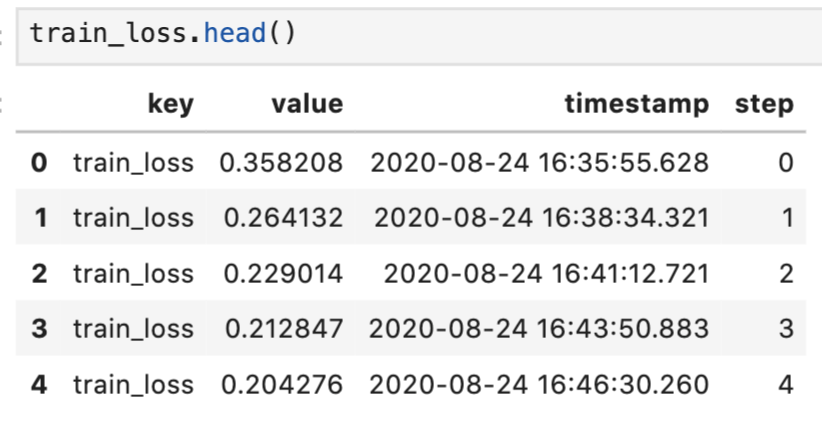
これを使って、metricの履歴をpandas.DataFrameとして取得する関数がこちらです。
timestampはdatetimeに変換すると扱いやすいです。
def get_metric_history(run_id, metric):
    client = mlflow.tracking.MlflowClient()
    history = client.get_metric_history(run_id, metric)
    history = [dict(key=m.key, value=m.value, timestamp=m.timestamp, step=m.step) for m in history]
    history = pd.DataFrame(history).sort_values("step")
    history.timestamp = pd.to_datetime(history.timestamp, unit="ms")
    return history

train_loss = get_metric_history(run_id, "train_loss")
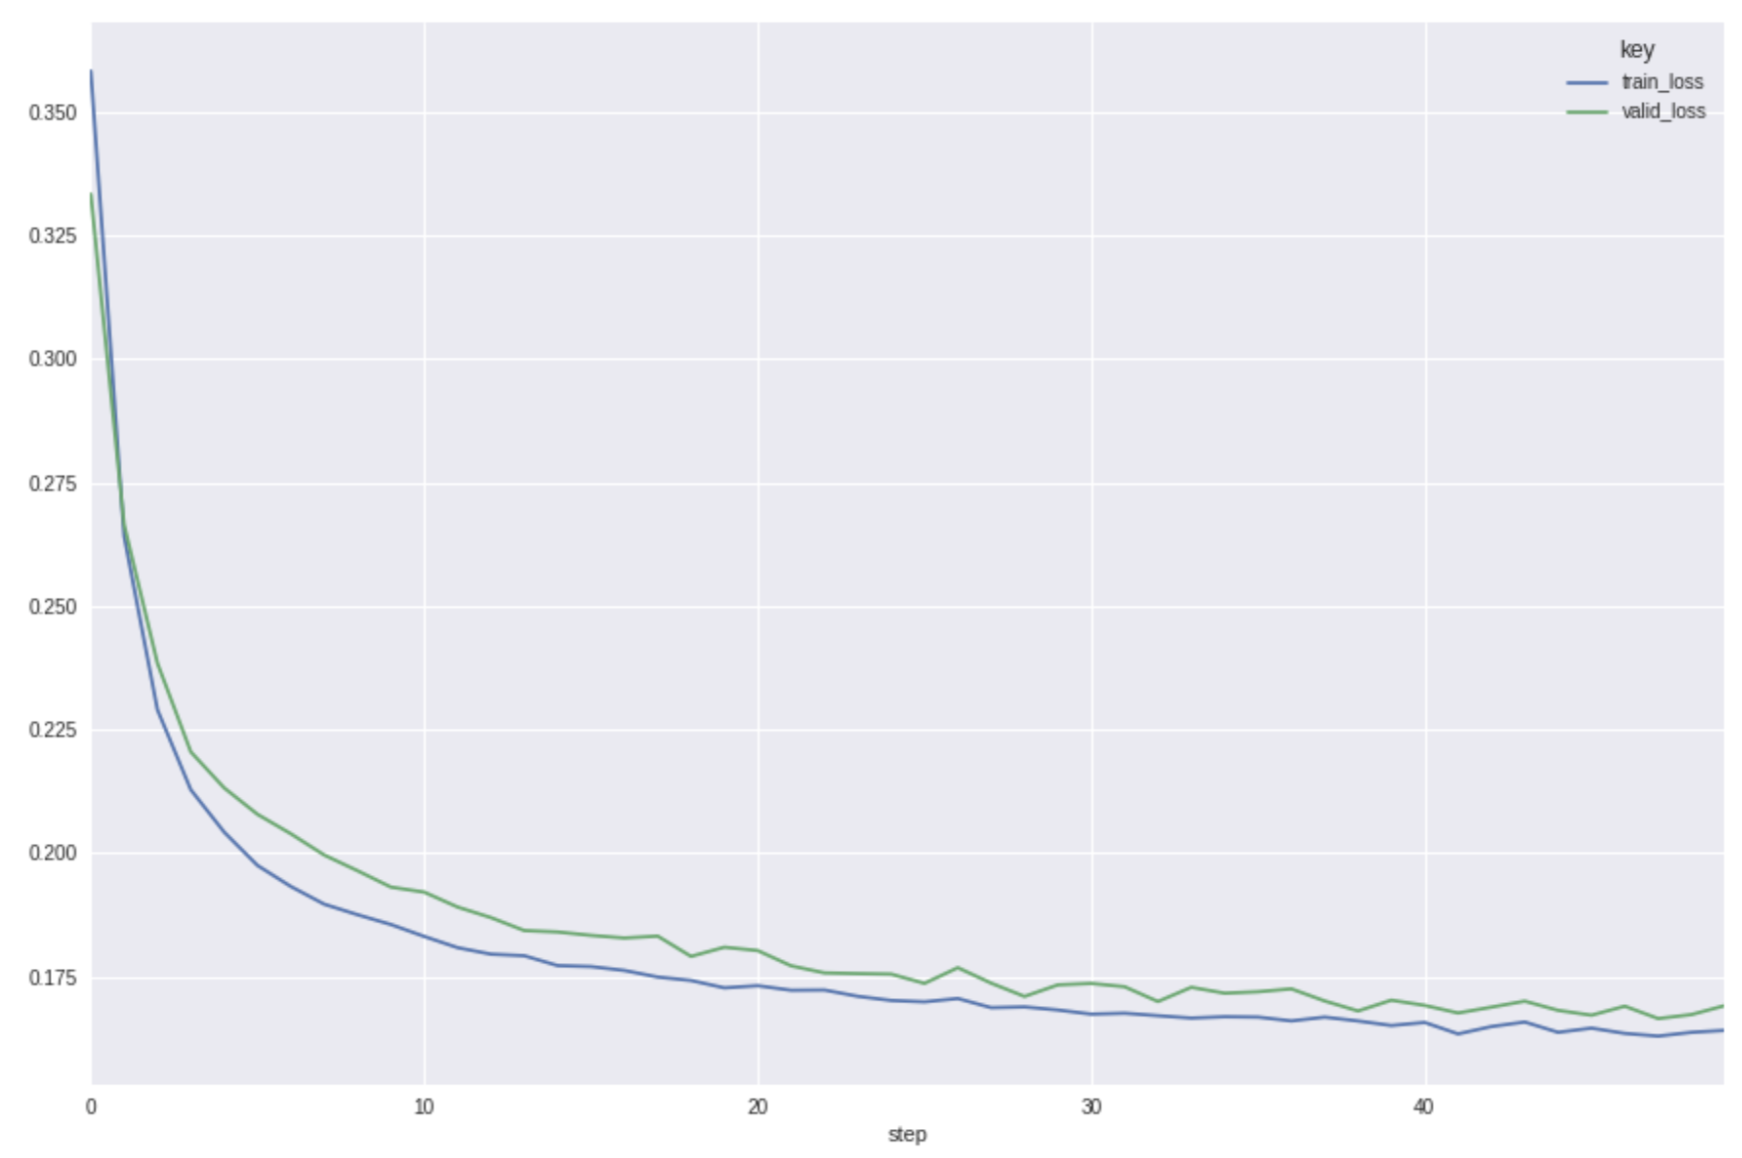
補足ですが、複数のmetricを比較してplotしたいときは、以下のようにDataframeを縦に結合した上で、pivotを使うと簡単に実現できます。
train_loss = get_metric_history(run_id, "train_loss")
valid_loss = get_metric_history(run_id, "valid_loss")
history = pd.concat((train_loss, valid_loss))
history.pivot(index="step", columns="key", values="value").plot()