人口移動が多いのは何月? e-Stat API機能 で取得したデータをプロットする
import os
import io
import requests
import pandas as pd
import seaborn as sns

%matplotlib inline
統計調査名を取得
url = "http://api.e-stat.go.jp/rest/3.0/app/getSimpleStatsList"
app_id = os.getenv("E_STAT_API_APP_ID")
params = {"appId": app_id, "statsNameList": "Y"}
response = requests.get(url, params=params)
csv_text = response.text[response.text.find('"TABLE_INF",') :]
df = pd.read_csv(io.StringIO(csv_text), dtype="object")
df[df.STAT_NAME.str.contains("人口")]
| TABLE_INF | STAT_CODE | STAT_NAME | GOV_ORG_CODE | GOV_ORG_NAME | |
|---|---|---|---|---|---|
| 14 | 00200502 | 00200502 | 社会・人口統計体系 | 00200 | 総務省 |
| 17 | 00200523 | 00200523 | 住民基本台帳人口移動報告 | 00200 | 総務省 |
| 18 | 00200524 | 00200524 | 人口推計 | 00200 | 総務省 |
| 76 | 00450011 | 00450011 | 人口動態調査 | 00450 | 厚生労働省 |
df[df.STAT_NAME.str.contains('人口')].iloc[1]
TABLE_INF           00200523
STAT_CODE           00200523
STAT_NAME       住民基本台帳人口移動報告
GOV_ORG_CODE           00200
GOV_ORG_NAME             総務省
Name: 17, dtype: object
table_inf = df[df.STAT_NAME.str.contains('人口')].iloc[1].TABLE_INF
統計表情報取得
url = "http://api.e-stat.go.jp/rest/3.0/app/getSimpleStatsList"
app_id = os.getenv("E_STAT_API_APP_ID")
params = {"appId": app_id, "statsCode": table_inf}
response = requests.get(url, params=params)
csv_text = response.text[response.text.find('"TABLE_INF",') :]
df = pd.read_csv(io.StringIO(csv_text), dtype="object")
table_inf = df[(df.CYCLE == "月次") & (df.TABLE_CATEGORY == "2010年1月~")].iloc[0].TABLE_INF
メタ情報取得
url = "http://api.e-stat.go.jp/rest/3.0/app/getSimpleMetaInfo"
params = {"appId": app_id, 'statsDataId':table_inf}
response = requests.get(url, params=params)
csv_text = response.text[response.text.find('"CLASS_OBJ_ID",') :]
df = pd.read_csv(io.StringIO(csv_text), dtype="object")
df.drop_duplicates('CLASS_OBJ_ID')
| CLASS_OBJ_ID | CLASS_OBJ_NAME | CLASS_CODE | CLASS_NAME | CLASS_LEVEL | CLASS_UNIT | CLASS_PARENT_CODE | CLASS_ADD_INF | CLASS_EXPLANATION | |
|---|---|---|---|---|---|---|---|---|---|
| 0 | tab | 表章項目 | 06 | 他都道府県からの転入者数 | NaN | 人 | NaN | NaN | NaN |
| 1 | cat01 | 性別 | 0 | 総数 | 1 | NaN | NaN | NaN | NaN |
| 4 | cat02 | 年齢(5歳階級) | 000 | 総数 | 1 | NaN | NaN | NaN | NaN |
| 24 | area | 全国・都道府県 | 00000 | 全国 | 1 | NaN | NaN | NaN | NaN |
| 72 | time | 時間軸(月次) | 2018001212 | 2018年12月 | 2 | NaN | 2018000000 | NaN | NaN |
統計データ取得
url = "http://api.e-stat.go.jp/rest/3.0/app/getSimpleStatsData"
params = {
    "appId": app_id,
    "statsDataId": table_inf,
    "cdArea": "00000",
    "cdCat01": "0",
    "cdCat02": "000",
}
response = requests.get(url, params=params)
csv_text = response.text[response.text.find('"tab_code",') :]
df = pd.read_csv(io.StringIO(csv_text), dtype="object")
プロット
df.pipe(
    lambda df: df.assign(year_month=pd.to_datetime(df["時間軸(月次)"], format="%Y年%m月"))
).pipe(
    lambda df: df[["year_month", "value"]]
    .astype({"value": int})
    .set_index("year_month")
    .sort_index()
).plot(
    figsize=(12, 3)
)
pass
(
    df.pipe(
        lambda df: df.assign(year_month=pd.to_datetime(df["時間軸(月次)"], format="%Y年%m月"))
    )
    .pipe(
        lambda df: df[["year_month", "value"]]
        .astype({"value": int})
        .set_index("year_month")
        .sort_index()
    )
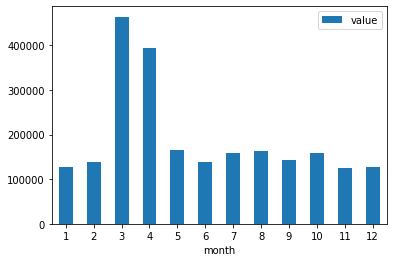
    .pipe(lambda df: df.assign(month=df.index.month))
    .groupby("month")
    .mean()
).plot.bar(rot=0)
pass
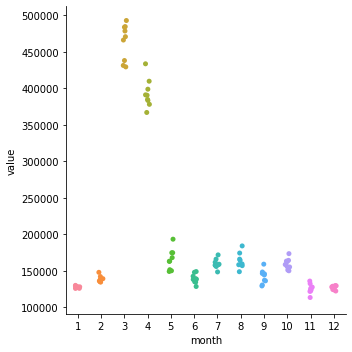
df_sns = (
    df.pipe(
        lambda df: df.assign(year_month=pd.to_datetime(df["時間軸(月次)"], format="%Y年%m月"))
    )
    .pipe(
        lambda df: df[["year_month", "value"]]
        .astype({"value": int})
        .set_index("year_month")
        .sort_index()
    )
    .pipe(lambda df: df.assign(month=df.index.month))
)
sns.catplot(x="month", y="value", data=df_sns)
pass
sns.violinplot(x="month", y="value", data=df_sns)
pass
sns.boxplot(x="month", y="value", data=df_sns)
pass


