Prophet の TypeError: float() argument must be a string or a number は plot の前に pd.plotting.register_matplotlib_converters() を追加すると解決する
Prophet の Quick Start を試してみる
import pandas as pd
from fbprophet import Prophet
df = pd.read_csv(
    "https://raw.githubusercontent.com/facebook/prophet/master/"
    "examples/example_wp_log_peyton_manning.csv"
)
df.head()
| ds | y | |
|---|---|---|
| 0 | 2007-12-10 | 9.590761 |
| 1 | 2007-12-11 | 8.519590 |
| 2 | 2007-12-12 | 8.183677 |
| 3 | 2007-12-13 | 8.072467 |
| 4 | 2007-12-14 | 7.893572 |
m = Prophet()
m.fit(df)
future = m.make_future_dataframe(periods=365)
future.tail()
INFO:fbprophet:Disabling daily seasonality. Run prophet with daily_seasonality=True to override this.
| ds | |
|---|---|
| 3265 | 2017-01-15 |
| 3266 | 2017-01-16 |
| 3267 | 2017-01-17 |
| 3268 | 2017-01-18 |
| 3269 | 2017-01-19 |
forecast = m.predict(future)
forecast[['ds', 'yhat', 'yhat_lower', 'yhat_upper']].tail()
| ds | yhat | yhat_lower | yhat_upper | |
|---|---|---|---|---|
| 3265 | 2017-01-15 | 8.204005 | 7.506318 | 8.897406 |
| 3266 | 2017-01-16 | 8.529004 | 7.833604 | 9.213509 |
| 3267 | 2017-01-17 | 8.316397 | 7.598104 | 9.071751 |
| 3268 | 2017-01-18 | 8.149020 | 7.405367 | 8.816930 |
| 3269 | 2017-01-19 | 8.160915 | 7.413687 | 8.862955 |
plot すると TypeError が発生する
try:
    fig1 = m.plot(forecast)
except TypeError as e:
    print(e)
float() argument must be a string or a number, not 'datetime.datetime'
plot の前に pd.plotting.register_matplotlib_converters() を追加すると解決する
(Prophet の issue を参照)
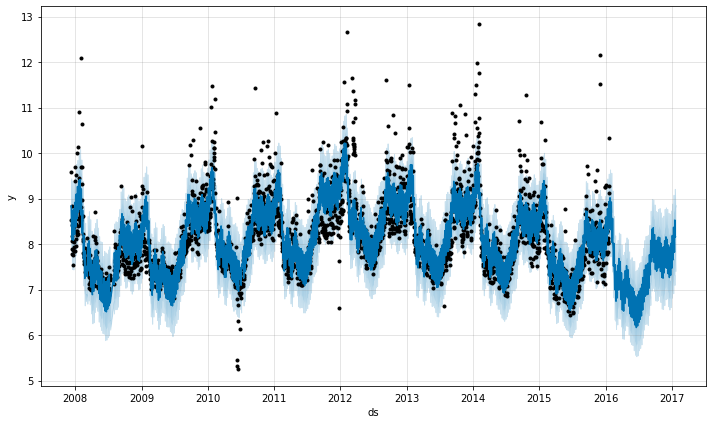
pd.plotting.register_matplotlib_converters()
plot 成功
fig1 = m.plot(forecast)