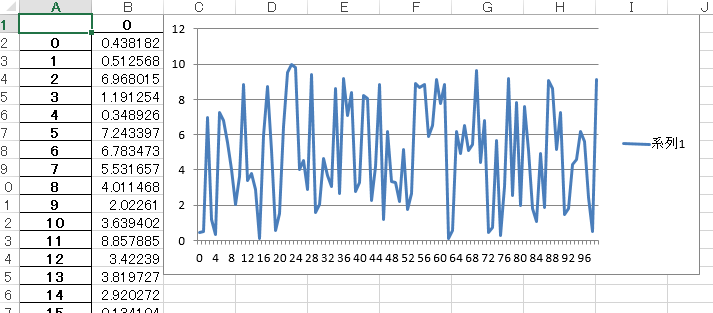
sin とか cos とか、どーでもいいから、取り敢えず単純に外部データをプロットさせたいんだよ!
ついでに。
エクセルでしか提出書類は受け付けん!
グラフはエクセルで書け!!
使うのは三度目の、rand.txt。
$ perl -le 'print rand (10) for 0 .. 99' > rand.txt
GRAPH.py
import pandas as pd
import matplotlib
matplotlib.use('Agg')
import sys
import matplotlib.pyplot as plt
data = pd.read_csv(sys.argv[1], header=None)
with pd.ExcelWriter(sys.argv[2], engine='xlsxwriter') as writer:
    data.to_excel(writer, 'Sheet1')
    wb = writer.book
    chart = wb.add_chart({'type': 'line'})
    en = str(data.shape[0] + 1)
    chart.add_series({'categories':'=Sheet1!$A$2:$A$' + en, 'values': '=Sheet1!$B$2:$B$' + en })
    writer.sheets['Sheet1'].insert_chart('C1', chart)
$ python GRAPH.py rand.txt graph.xlsx
-
XlsxWriterは、Anacondaを入れてるなら自動的に入るが、手動でpandasを入れた環境では別途インストールが必要1。
-
軽くコレで嵌りかけた。 ↩
