この記事で紹介すること
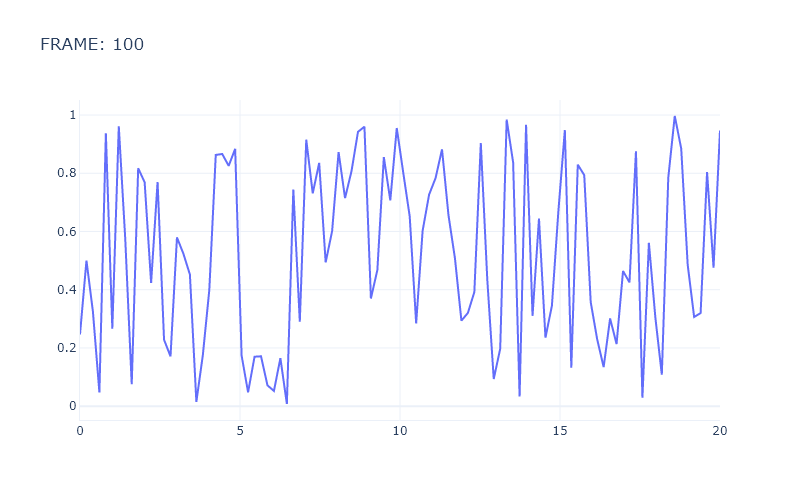
グラフ作成ライブラリPlotlyをつかってリアルタイムに変動するグラフを作成します。
ここで想定しているグラフは株価などではなく、レーダーなど計測装置の測定データを逐次Jupyter notebook上で作成したグラフに反映させるイメージです。
コードはGitHubにアップロードしてあります。https://github.com/bridget462/plotly_live_graph/blob/master/plotly_live_graph.ipynb
Plotlyとは
Plotlyとは簡単に見た目のいいグラフを作ってくれるライブラリです。
デフォルトの設定でこんな感じなグラフを作れます
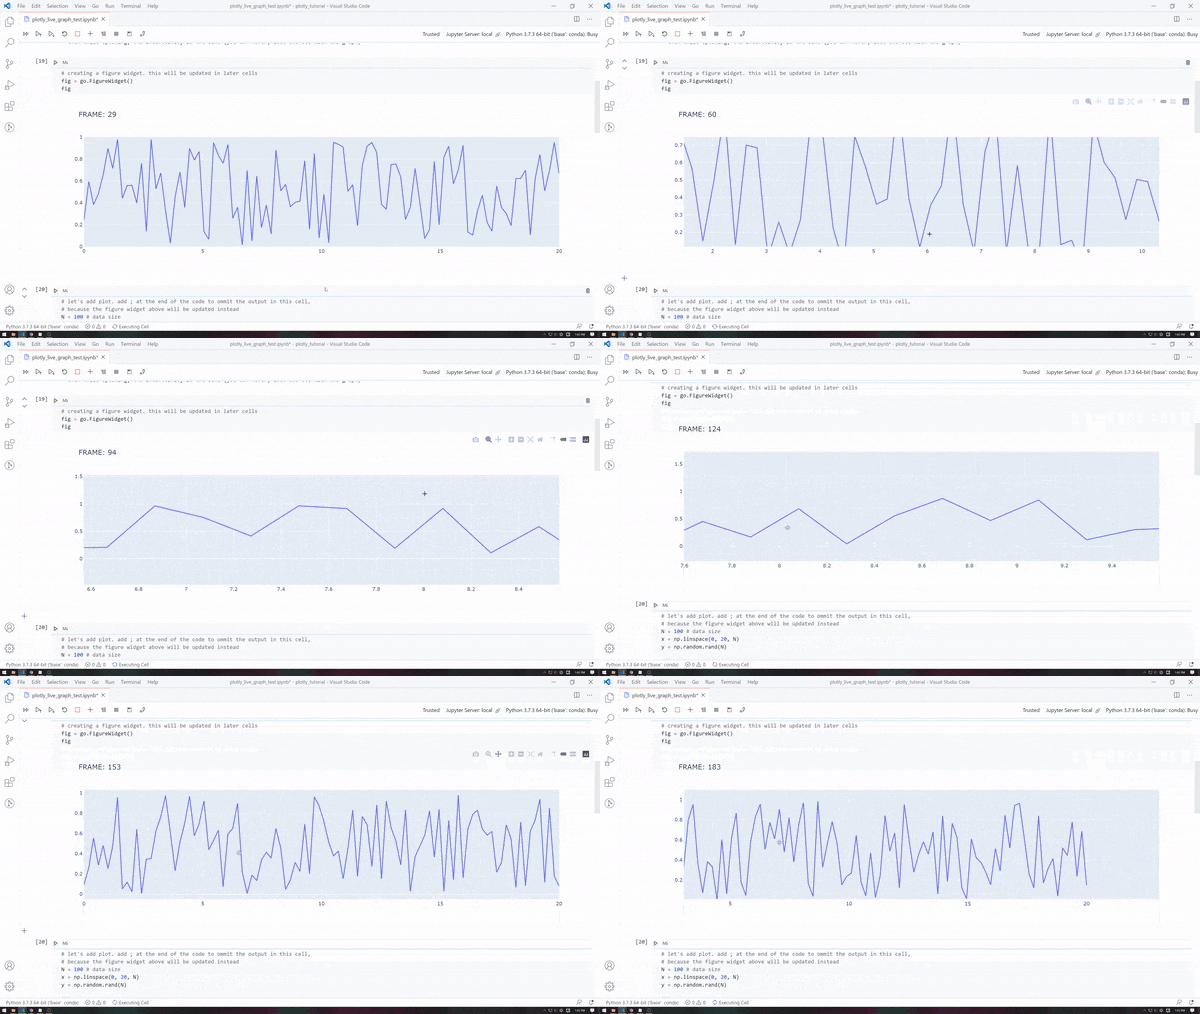
Plotlyではインタラクティブなグラフを作成できます。例えばマウスをホバーすると付近のデータの値を表示してくれたり、拡大縮小移動などができます。
本当はQiitaの記事にもグラフを載せたかったのですが、インタラクティブな状態のhtmlファイルのグラフを載せられなかったので、動画を貼っておきます。
Plotlyでリアルタイムグラフ
Plotlyでの様々な種類のグラフ作成法については多くの記事がありますが、リアルタイムにグラフを更新する方法についての解説が少なかったので今回ここにまとめます。
この記事では乱数を用いて変化するデータをリアルタイムに反映するグラフを作成します。この乱数の部分を各自、測定データなどに置き換えればリアルタイムにデータを可視化することができると思います。
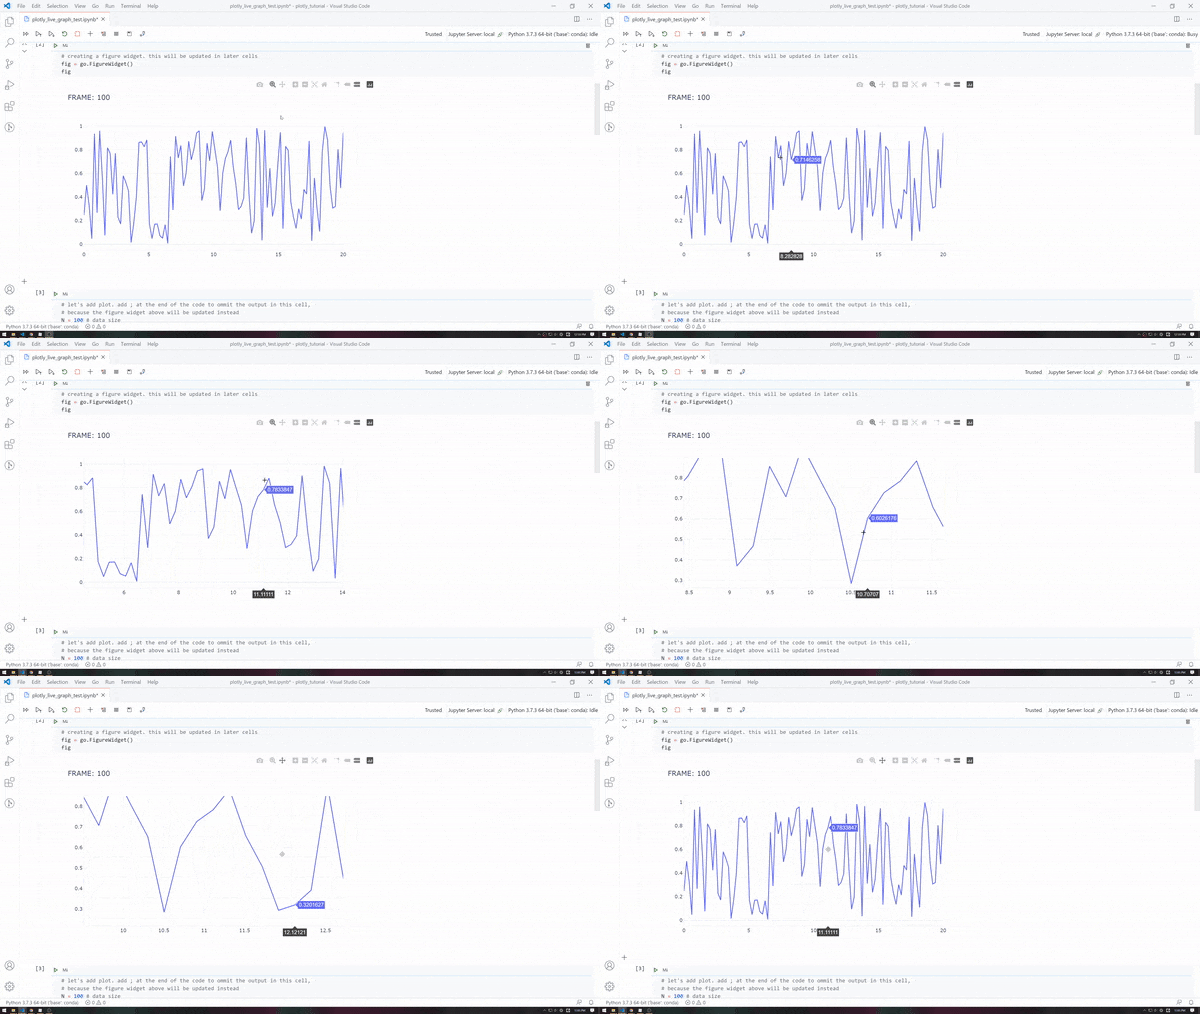
作成するリアルタイムグラフ。リアルタイムグラフでもインタラクティブな操作は可能でした。
実装
環境
jupyter notebook上でコードを書きます。
コード
まずはライブラリをインポート。
# importing libraries
import plotly.graph_objects as go # to make a graph
import numpy as np # to generate test data
plotlyでリアルタイムグラフを作る手順は大まかに:
- figure widgetを作る
- figure widgetにデータを追加する
- figure widgetを参照してデータをアップデートする
です。
1. figure widgetを作る
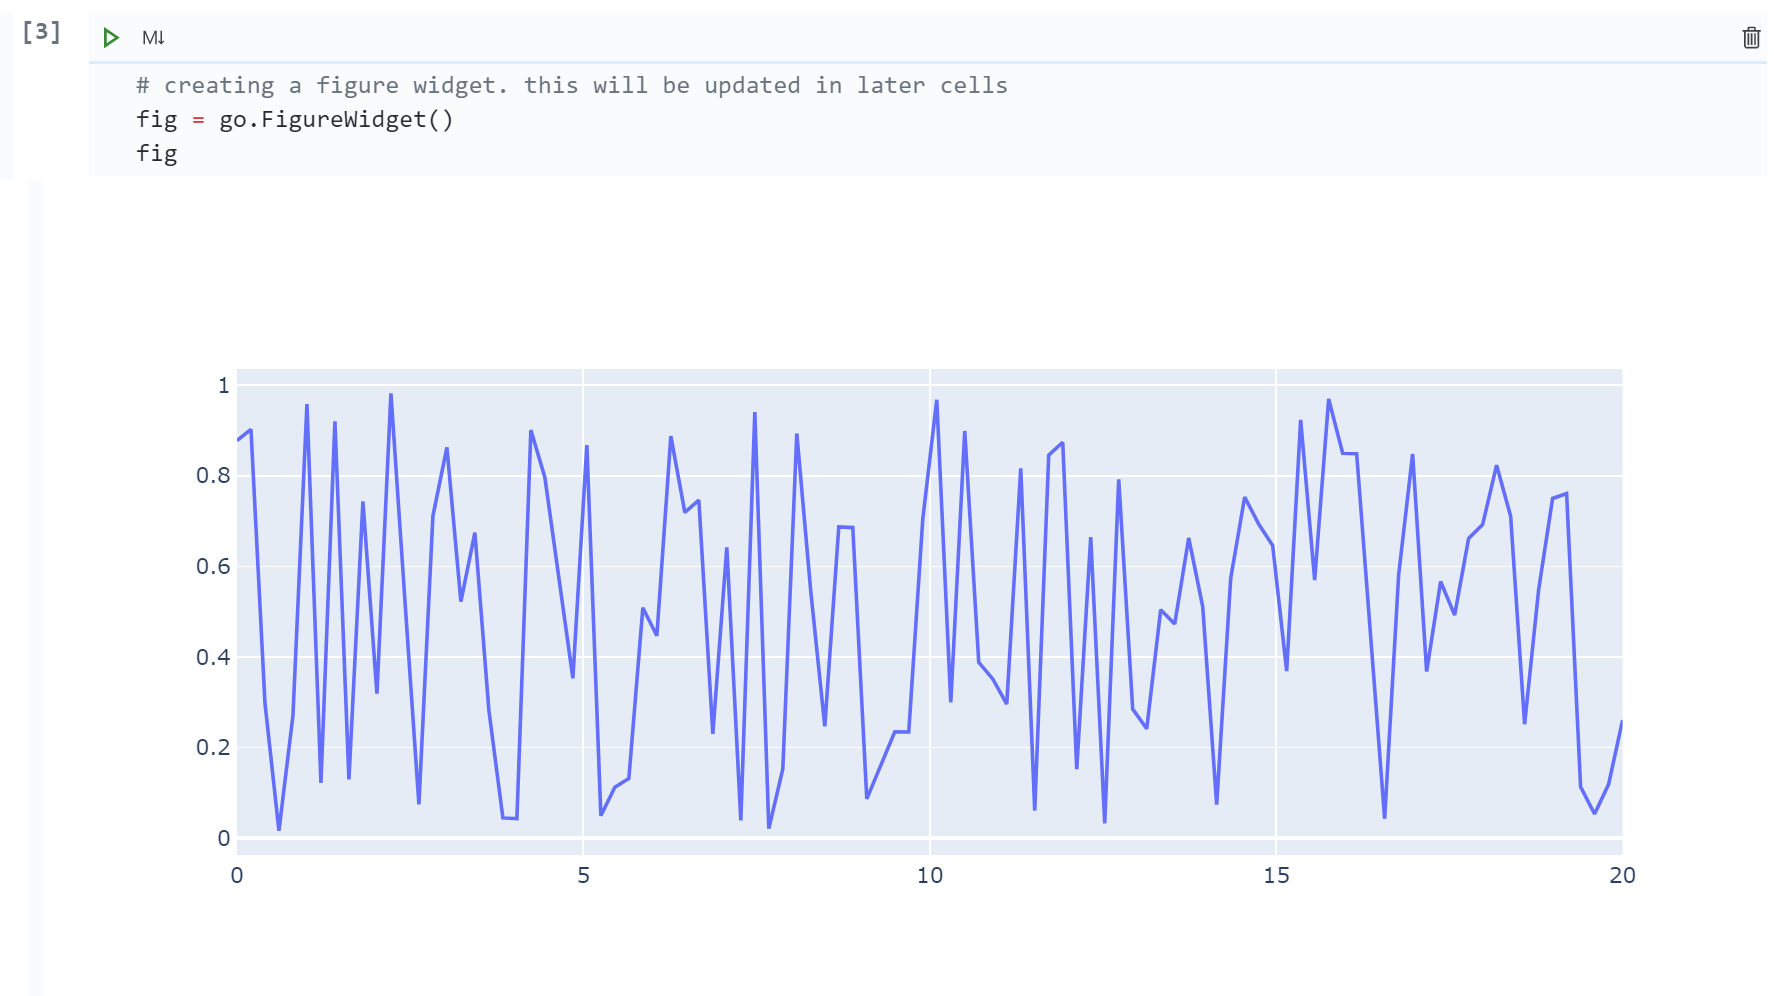
# creating a figure widget. this will be updated in later cells
fig = go.FigureWidget()
fig
このコードをjupyter notebook上で実行すると、セルの出力に空のグラフが表示されます。
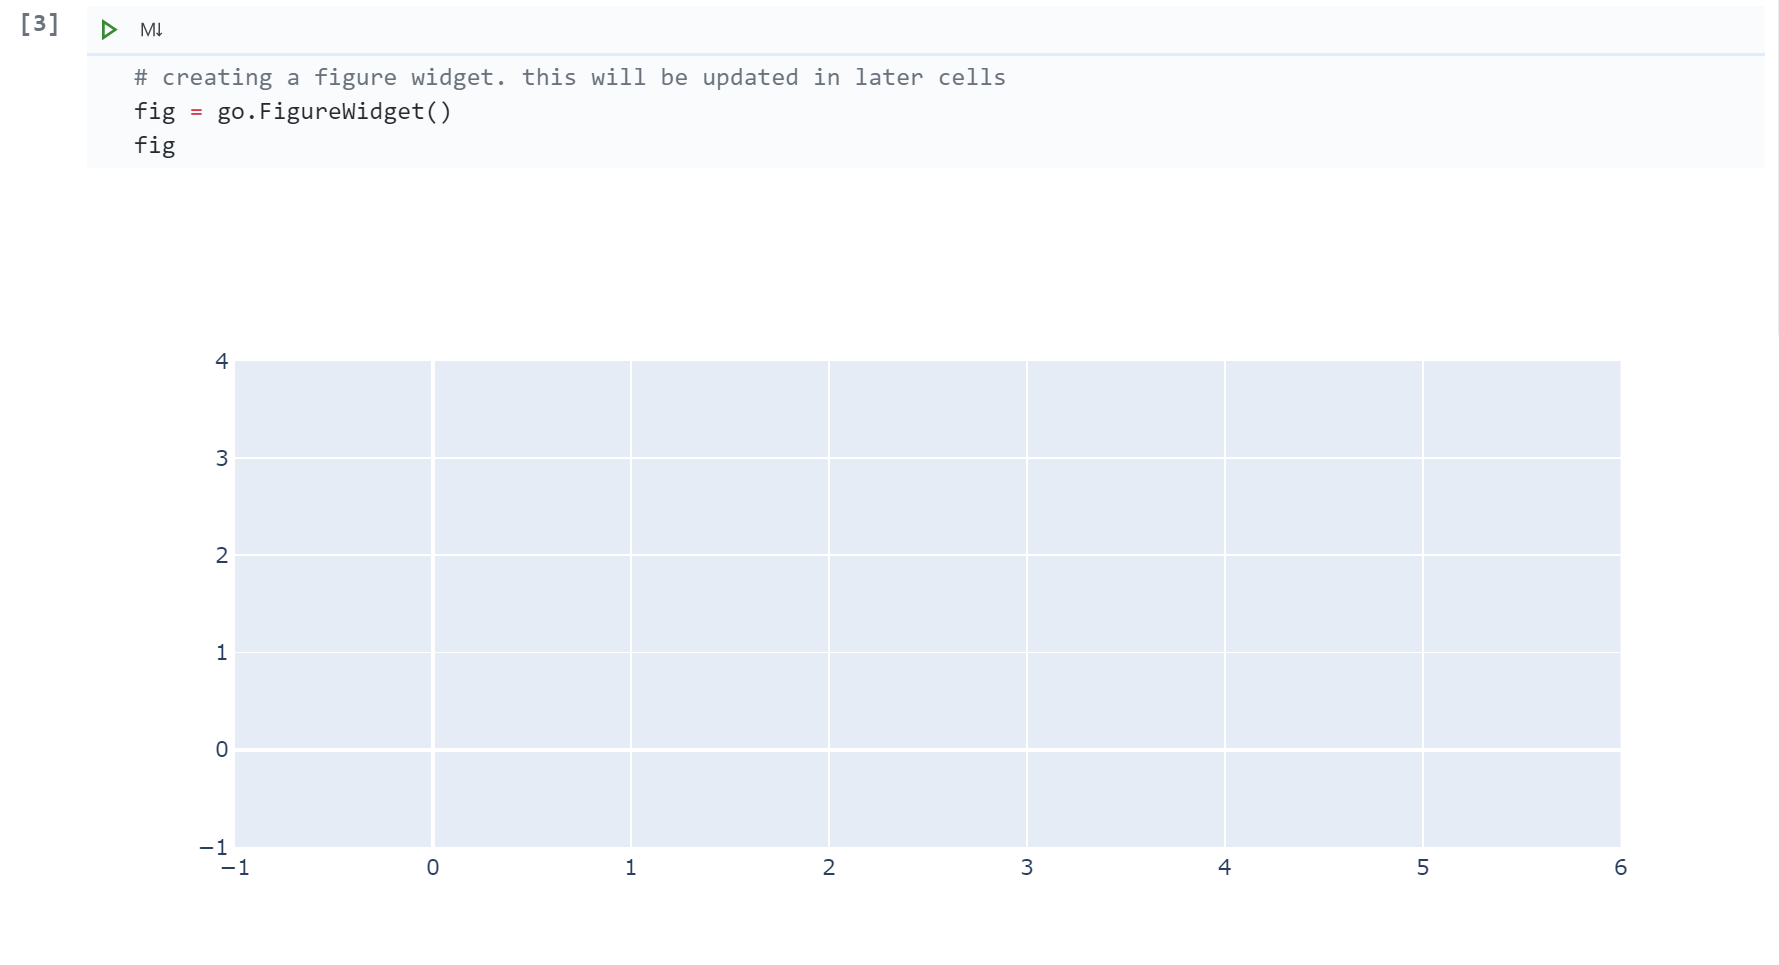
ここで作成したfigを他のセルで更新していきます。更新はリアルタイムに反映されます。
2. figure widgetにデータを追加する
# let's add plot. add ; at the end of the code to ommit the output in this cell,
# because the figure widget above will be updated instead
N = 100 # data size
x = np.linspace(0, 20, N)
y = np.random.rand(N)

fig.add_scatter(x=x, y=y);
例としてx軸は固定、y軸に0から1の乱数をとるデータを追加してみます。
fig.add_scatter(x=x, y=y);の最後のセミコロン;はグラフを重複して表示しないためです。
;がない場合、データを追加したグラフが実行したセルの下にも表示されますが、figure widgetを作成したさっきのグラフがアップデートされるので不要です。
 > 先ほど作成したグラフがアップデートされます。
3. figure widgetを参照してデータをアップデートする
# to update the plot, take the correct reference by fig.data[i] where i is the order which you added the plot
# in this example, let's modefiy the first scatter plot (fig.data[0])

# getting reference from the graph
first_scatter_plot = fig.data[0]

# assine new random values. as soon as this code is excuted, the graph above will be updated.
first_scatter_plot.y = np.random.rand(N)
2.で追加したデータをアップデートするイメージです。先ほどfig.add_scatter()で最初に追加したデータを参考するにはfig.data[0]と書きます。
もし他にもデータを追加していた場合は、追加した順番を覚えておく必要があります(2番目に追加したデータはfig.data[1]で参照する)。
その他
複数回グラフを更新するためにfor分をつかってグラフをアップデートしてみましょう。以下のセルには更新が何回目かを示すためにタイトルも変化させてます。
# let's update both title and the y data at the same time
FRAME = 1000 # how many times which update the graph
first_scatter_plot = fig.data[0] # getting reference from the graph

for i in range(FRAME):
    first_scatter_plot.y = np.random.rand(N) # updating y data
    fig.update_layout(title=f'FRAME: {i + 1}');
実行すると記事の冒頭にあった動画のように変化するグラフが作成できます。
他にもy軸の表示範囲の設定やグラフの保存などのコードはGitHubのノートにあるので気になる方は参照してください。
https://github.com/bridget462/plotly_live_graph/blob/master/plotly_live_graph.ipynb

