記事の目的
matplotlibでグラフ作成するときに、標準のグリッド(目盛り線)では物足りなさを感じている人も少なからずいるはず。この記事では技術レポートにおススメな筆者好みのグリッド設定を最小労力で設定する方法を提案する。
技術レポートに求められるグリッド(持論)
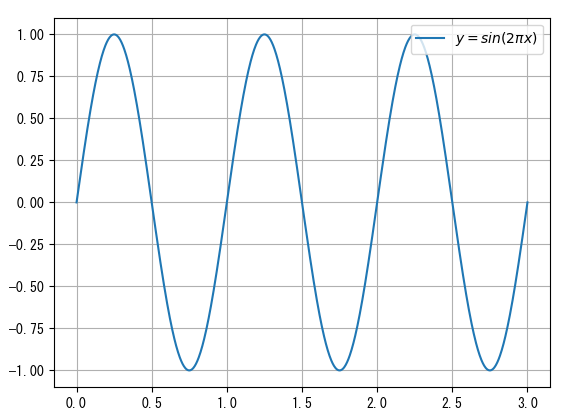
matplotlibの関数gridで表示されるおなじみの標準なグリッドは以下。
技術レポートに記載するグラフは、グラフ画像だけ見ても、それを示す値が「おおよそ」分かる程度にグリッドが細かくあるのが望ましい。ここの「おおよそ」というのにはかなり個人差があると思われるが、少なくとも標準(plt.grid()のみ)では補助目盛が無く物足りないと感じるだろう。
一方で、補助目盛間隔の値設定など毎グラフごとの細かい設定には悩みたくはない。
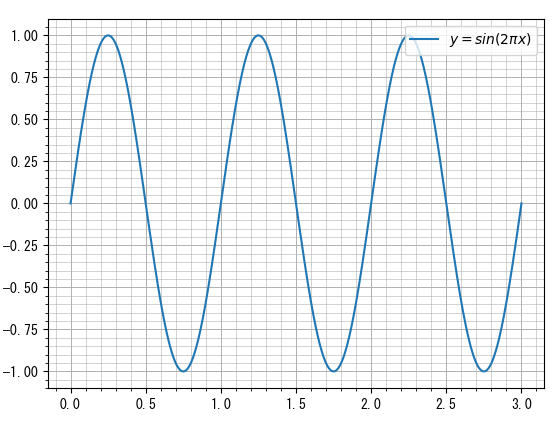
上記を受けて、筆者がお勧めしたいグリッドは以下。
グリッド仕様のポイントを整理する。
- 主目盛は標準グリッドの通りにオートスケールで調整される
- 主目盛り1つ分は、常に補助目盛5つ分になっている
- 主目盛りは補助目盛より若干太め
これにより、目で読み取れる程度の補助目盛間隔を維持しつつ、「(主目盛間隔) ÷ 5 = (補助目盛間隔)」から瞬時に値が読み取れる。(「5」は、みんなが一番慣れ親しんでいるはずの値)
まずはベタに実装
実装例を以下に示す。
なお、筆者がmatoplotlibを使うときには、ひと手間だが「fig, ax = plt.subplots()」でグラフオブジェクト fig , 軸オブジェクト ax (あるいは軸オブジェクト配列)を準備するようにしている。
import numpy as np
import matplotlib.pyplot as plt

# %% テスト信号の定義
x = np.linspace(0,3,1001)
y = np.sin(2*np.pi*x)

# %% 標準グリッドによる描画 ########
fig_1, ax_1 = plt.subplots()
ax_1.plot(x,y)
ax_1.legend(["$y=sin(2 \pi x)$"], loc=1)
ax_1.grid() # 標準

# %% おススメグリッドによる描画 ########
fig_2, ax_2 = plt.subplots()
ax_2.plot(x,y)
ax_2.legend(["$y=sin(2 \pi x)$"], loc=1)

import matplotlib.ticker as ticker
ax_2.grid(which='major', lw=0.7) # 主目盛の描画(標準)

# X,Y軸に対して、(補助目盛)×5 = (主目盛)
ax_2.xaxis.set_minor_locator(ticker.AutoMinorLocator(5))
ax_2.yaxis.set_minor_locator(ticker.AutoMinorLocator(5))
ax_2.grid(which='minor', lw=0.4) # 補助目盛の描画
関数化による汎用化
何度も書くのは大変なのと、いつも思い出しに時間がかかるので、関数setGridPreferedとしてまとめてみた。筆者は、このグリッド設定関数を、.pyでいつも作るスクリプトの上の方、ライブラリをimportする箇所のすぐ下あたりに忍ばせることにしている。
import numpy as np
import matplotlib.pyplot as plt

# %%
def setGridPrefered(ax):
    """
    好みのグリッドを設定するための関数

    Parameters
    ----------
    ax : matplotlibの軸オブジェクト

    """

    import matplotlib.ticker as ticker
    ax.grid(which='major', lw=0.7) # 主目盛の描画(標準)

    # X,Y軸に対して、(補助目盛)×5 = (主目盛)
    ax.xaxis.set_minor_locator(ticker.AutoMinorLocator(5))
    ax.yaxis.set_minor_locator(ticker.AutoMinorLocator(5))
    ax.grid(which='minor', lw=0.4) # 補助目盛の描画

if __name__ == "__main__":

    x = np.linspace(0,3,1001)
    y = np.sin(2*np.pi*x)

    #%% 使い方
    fig_2, ax_2 = plt.subplots()
    ax_2.plot(x,y)
    ax_2.legend(["$y=sin(2 \pi x)$"], loc=1)
    setGridPrefered(ax_2) # 軸オブジェクトを引数するようにして使う。

    #%% 複数軸のグラフの場合
    fig_3, axes_3 = plt.subplots(3,2)
    # 軸オブジェクト配列をflatにしてforループすればよい
    for ax_i in axes_3.flatten():
        ax_i.plot(x,y)
        setGridPrefered(ax_i)
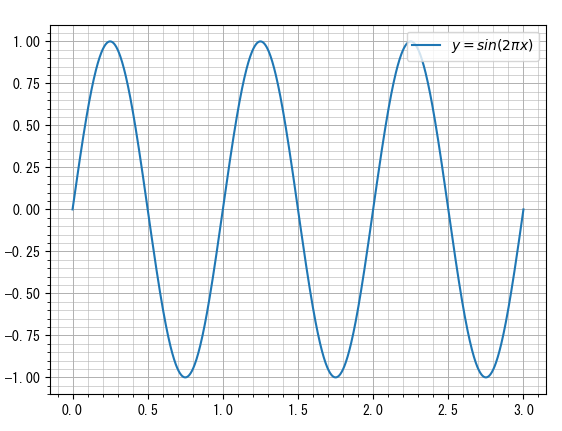
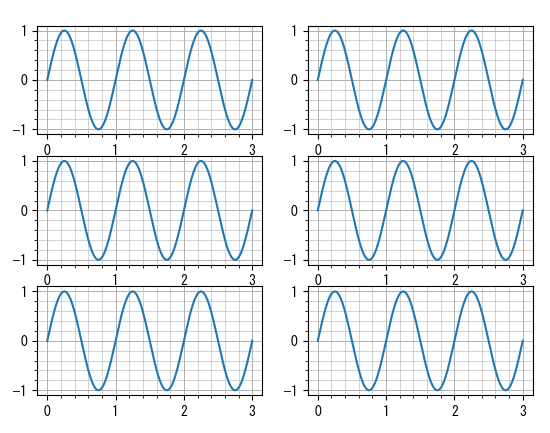
出力は以下。
終わりに(感想)
Pythonは今や情報過多になりすぎているため、どの実装が一番「自分にとっての正解」なのかを迷うところがある。筆者も、今回のたった数行のグリッド設定関数にたどり着くまでにかなりの時間と経験が必要だった。その甲斐あって、特に筆者のようにものづくりエンジニアとして働く人にとっては、この設定方法はすぐにでも現場で使えるものになっていると自負している。ぜひご意見いただければ幸いです。
以上


