クロス集計といえばデータ分析の基本中の基本。
R言語でもクロス集計はできますが、基本機能すぎていくつもの方法があります。
この記事ではR言語でクロス集計を行う8つの関数を紹介します。
- base::table()
- stats::xtabs()
- dplyr::summarise()
- dplyr::count()
- summarytools::ctable()
- gtsummary::tbl_cross()
- janitor::tabyl()
- crosstable::crosstable()
今回はMASSパッケージに含まれるsurveyデータセットをデモデータとして使います。
このデータはアデレード大学の講義「統計学I」の学生237人に対して行われたアンケート調査のデータです。
tidyverseもここで呼び出しておきましょう。
library(conflicted)
library(tidyverse)
library(MASS)
data(survey)
少し前処理をしておきます。実年齢を年代(10代、20代以上)に区分し、変数を性別、年代、運動習慣、喫煙習慣、身長に絞ります。
survey_edit <- survey |>
  mutate(
    Age2 = case_when(
      Age < 20 ~ "10代",
      Age >= 20 ~ "20代以上"
      )
    ) |>
  dplyr::select(Sex, Age2, Exer, Smoke, Height)
base::table()
まずは基本中の基本、baseパッケージに含まれるtable()関数です。
集計結果を他の分析に使いたい場合や、とにかくさっと結果を出したいときに便利です。
三重クロス、四重クロスも可能です。
table(survey_edit$Exer)
# Freq None Some
#  115   24   98

table(survey_edit$Age2, survey_edit$Exer)
#            Freq None Some
#   10代       77   16   78
#   20代以上   38    8   20

table(survey_edit$Age2, survey_edit$Exer, survey_edit$Sex)
# , ,  = Female
#
#            Freq None Some
#   10代       34    6   48
#   20代以上   15    5   10
#
# , ,  = Male
#
#            Freq None Some
#   10代       43   10   30
#   20代以上   22    3   10
欠損値は無視されてしまうので注意が必要です。
欠損値も集計に含めたい場合は引数としてexclude = NULLを加えます。
table(survey_edit$Age2, survey_edit$Smoke, exclude = NULL)
#            Heavy Never Occas Regul <NA>
#   10代         5   138    16    11    1
#   20代以上     6    51     3     6    0
周辺度数を付けるにはtable()による集計結果をaddmargins()に与えればOKです。
tb1 <- table(survey_edit$Age2, survey_edit$Exer)
addmargins(tb1)
#            Freq None Some Sum
#   10代       77   16   78 171
#   20代以上   38    8   20  66
#   Sum       115   24   98 237
度数ではなく割合を知りたい場合はproportions()関数を使います。
proportions(tb1) #全体
#                  Freq       None       Some
#   10代     0.32489451 0.06751055 0.32911392
#   20代以上 0.16033755 0.03375527 0.08438819

proportions(tb1, margin = 1) #行ごと
#                  Freq       None       Some
#   10代     0.45029240 0.09356725 0.45614035
#   20代以上 0.57575758 0.12121212 0.30303030

proportions(tb1, margin = 2) #列ごと
#                 Freq      None      Some
#   10代     0.6695652 0.6666667 0.7959184
#   20代以上 0.3304348 0.3333333 0.2040816
stats::xtabs()
こちらも基本の関数です。
変数名の見出しが付くのはtable()より気が利いてますね。
またフォーミュラ形式で指定できるのと、パイプ演算子でも使いやすいのがいいですね。
table()同様にaddmargins()、proportions()なども使えます。
survey_edit |>
  xtabs(~ Age2 + Smoke, data = _)
#           Smoke
# Age2       Heavy Never Occas Regul
#   10代         5   138    16    11
#   20代以上     6    51     3     6
dplyr::summarise()
みんな大好きtidyverseでもsummary()関数でクロス集計ができます。
出力がtidyなのがいいですね。
survey_edit |>
  summarise(n = n(), .by = c(Age2, Smoke))
#       Age2 Smoke   n
# 1     10代 Never 138
# 2     10代 Regul  11
# 3     10代 Occas  16
# 4 20代以上 Never  51
# 5 20代以上 Occas   3
# 6 20代以上 Heavy   6
# 7 20代以上 Regul   6
# 8     10代  <NA>   1
# 9     10代 Heavy   5
dplyr::count()
count()関数でも同様の集計ができます。
survey_edit |>
  count(Age2, Smoke)
#       Age2 Smoke   n
# 1     10代 Heavy   5
# 2     10代 Never 138
# 3     10代 Occas  16
# 4     10代 Regul  11
# 5     10代  <NA>   1
# 6 20代以上 Heavy   6
# 7 20代以上 Never  51
# 8 20代以上 Occas   3
# 9 20代以上 Regul   6
summarytools::ctable()
さて、ここからは専用のパッケージを使ってみましょう。
まずはsummarytoolsパッケージのctable()関数です。
だいぶ見やすい集計表を出力してくれますね。
RMarkdown用の出力オプションもあります。
library(summarytools)
ctable(survey_edit$Age2, survey_edit$Smoke)
# Cross-Tabulation, Row Proportions
# Age2 * Smoke
# Data Frame: survey_edit
#
# ---------- ------- ----------- ------------- ----------- ----------- ---------- --------------
#              Smoke       Heavy         Never       Occas       Regul       <NA>          Total
#       Age2
#       10代            5 (2.9%)   138 (80.7%)   16 (9.4%)   11 (6.4%)   1 (0.6%)   171 (100.0%)
#   20代以上            6 (9.1%)    51 (77.3%)    3 (4.5%)    6 (9.1%)   0 (0.0%)    66 (100.0%)
#      Total           11 (4.6%)   189 (79.7%)   19 (8.0%)   17 (7.2%)   1 (0.4%)   237 (100.0%)
# ---------- ------- ----------- ------------- ----------- ----------- ---------- --------------
janitor::tabyl()
janitorパッケージは前処理に便利なツールの詰め合わせですが、tabyl()関数がクロス集計に使えます。
シンプルな集計もできますし、いろいろ工夫を加えることもできます。
なお、tabyl()に関してはniszetさんの記事も詳しいです。
library(janitor)
survey_edit |>
  tabyl(Age2, Smoke)
#      Age2 Heavy Never Occas Regul NA_
#      10代     5   138    16    11   1
#  20代以上     6    51     3     6   0

survey_edit |>
  tabyl(Age2, Smoke) |>
    adorn_totals() |>
    adorn_percentages("col") |>
    adorn_pct_formatting(digits = 1) |>
    adorn_ns() |>
    adorn_title("combined")
#  Age2/Smoke       Heavy        Never       Occas       Regul        NA_
#        10代  45.5%  (5)  73.0% (138)  84.2% (16)  64.7% (11) 100.0% (1)
#    20代以上  54.5%  (6)  27.0%  (51)  15.8%  (3)  35.3%  (6)   0.0% (0)
#       Total 100.0% (11) 100.0% (189) 100.0% (19) 100.0% (17) 100.0% (1)
gtsummary::tbl_cross()
gtsummaryも人気のあるパッケージですね。
こちらは画像できれいな表を出力してくれます。
RMarkdownとの相性も良いです。
library(gtsummary)
survey_edit |>
  tbl_cross(row = Smoke, col = Age2)

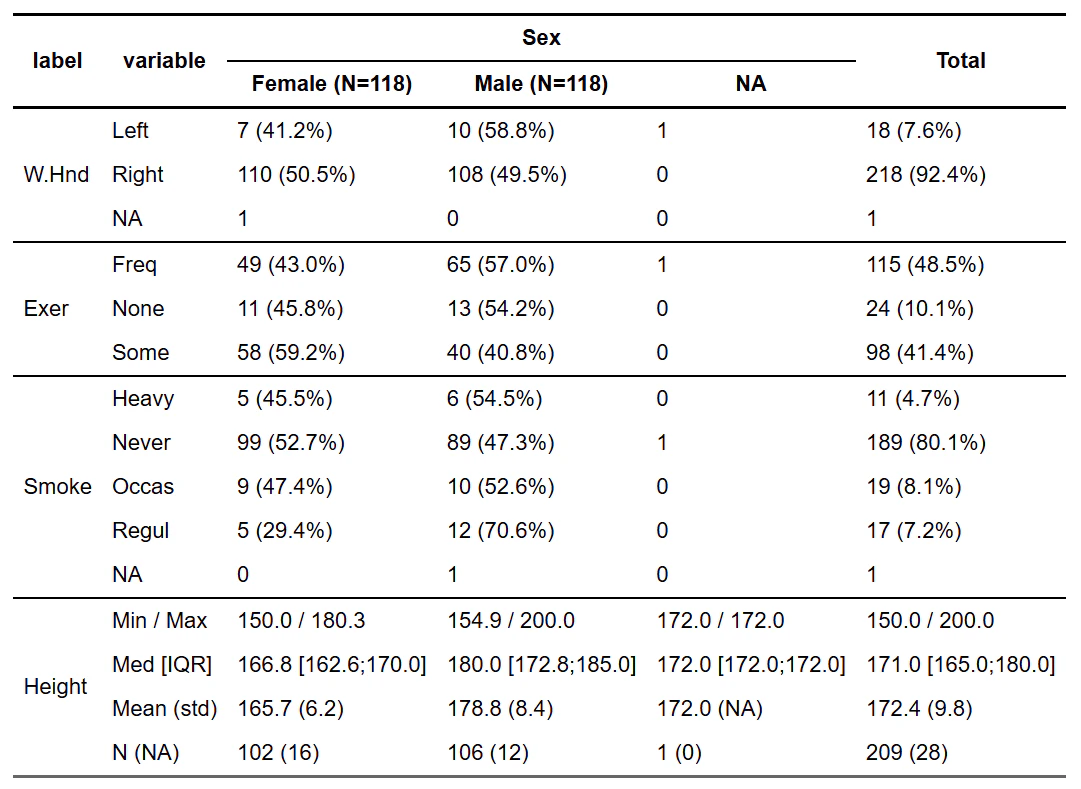
crosstable::crosstable()
集計軸を指定したら複数の項目とのクロス集計を一度に出力してくれるのが便利。
こちらもRMarkdownと相性が良いです。
library(crosstable)
survey_edit |>
  crosstable(
    cols = c(W.Hnd, Exer, Smoke, Height),
    by = Sex,
    percent_digits = 1,
    total = "row"
    ) |>
  as_flextable(keep_id= FALSE, header_show_n =TRUE)
以上です!
Enjoy!