このページでは[「P5.js 日本語リファレンス」] (https://qiita.com/bit0101/items/91818244dc26c767a0fe) の curvePoint関数を説明します。
curvePoint()
説明文
ポイント a、b、c、d の位置 t の曲線の値を算出します。パラメータ t は 0 と 1 の間で変化します。a と d は曲線の制御点で、b と c は曲線の始点と終点です。これは x 座標、y 座標それぞれで実行して t での曲線の位置を取得できます。
構文
curvePoint(a, b, c, d, t)
パラメタ
-
a
Number:曲線の最初の制御点の座標 -
b
Number:最初の点の座標 -
c
Number:2番目の点の座標 -
d
Number:2番目の制御点の座標 -
t
Number:0 と 1 の間の値
戻り値
Number:位置 t の bezier 値
例
function draw(){
  noFill();
  stroke(255, 0, 0);
  curve(5, 26, 5, 26, 73, 24, 73, 100); // 赤色の曲線を描画

  stroke(0, 0, 255);
  curve(5, 26, 73, 24, 53, 61, 15, 65); // 青色の曲線を描画

  fill(255);
  let steps = 4;

  for(let i = 0; i <= steps; i++){
    let t = i / steps;
    let x = curvePoint(5, 5, 73, 73, t); // 赤色の曲線上の x 座標を算出
    let y = curvePoint(26, 26, 24, 100, t); // 赤色の曲線上の y 座標を算出
    stroke(255, 200, 0); // オレンジ色を設定
    ellipse(x, y, 5, 5); // 算出したxy座標上に円を描画

    x = curvePoint(5, 73, 53, 15, t); // 青色の曲線上の x 座標を算出
    y = curvePoint(26, 24, 61, 65, t); // 青色の曲線上の y 座標を算出
    stroke(0, 200, 255); // 水色を設定
    ellipse(x, y, 5, 5); // 算出したxy座標上に円を描画
  }
}
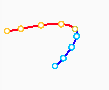
実行結果
著作権
p5.js was created by Lauren McCarthy and is developed by a community of collaborators, with support from the Processing Foundation and NYU ITP. Identity and graphic design by Jerel Johnson.
ライセンス
Creative Commons(CC BY-NC-SA 4.0) に従います。