概要
scikit-rfという高周波回路の測定データをグラフ化できるライブラリで、Jupyter Notebook使っていい感じにS21を表示してpngファイルに保存するコードを生成AIの力を借りつつ書いたけど意外と手間だったので、忘れないようにメモ。
環境
Windows 11 Pro
scikit-rf 1.7.0
matplotlib 3.10.3
インストールとJupyter Notebook起動
容量が大きいのでvenvで仮想環境作ってインストールするのが良いかも
> python -m venv myenv
> .\myenv\Scripts\activate
> pip install scikit-rf
> pip install matplotlib
> jupyter notebook
フォルダツリー
root
├─dat(データ保存場所)
│      aaa.s2p
│      bbb.s2p
│      ccc.s2p
│
├─plots(グラフ保存場所)
│
└─myenv (仮想環境)
コード
import numpy as np
import os
from matplotlib import pyplot as plt
from matplotlib import style

# S2P ファイルの読み込み
aaa = rf.Network('../dat/aaa.s2p',f_unit='ghz')
bbb = rf.Network('../dat/bbb.s2p',f_unit='ghz')
ccc = rf.Network('../dat/ccc.s2p',f_unit='ghz')

# スタイル設定
mpl_style = "seaborn-ticks"
mpl_style = mpl_style if mpl_style in style.available else "seaborn-v0_8-ticks"

# 保存先フォルダ
output_dir = '../plots'
os.makedirs(output_dir, exist_ok=True)

# グラフタイトル
title_str = "ATT 5dB measurements by sweep points"

# 0除算のwarningを回避する
np.seterr(divide = 'ignore')

# グラフ表示
with style.context(mpl_style):

    # aaa の S21 プロット、破線表示
    aaa.plot_s_db(m=1, n=0, label='aaa', linestyle = '--')

    # bbb の S21 プロット
    bbb.plot_s_db(m=1, n=0, label='bbb')

    # ccc の S21 プロット
    ccc.plot_s_db(m=1, n=0, label='ccc')

    # グラフの表示変更
    plt.xlabel('Frequency [GHz]')
    plt.ylabel('Magnitude [dB]')
    # plt.title(title_str) # グラフタイトル
    plt.grid(True)

    # 凡例を装飾して表示
    legend = plt.legend(loc='lower left', frameon=True)
    legend.get_frame().set_edgecolor('gray')
    legend.get_frame().set_linewidth(1.0)
    legend.get_frame().set_facecolor('white')

    # ファイル名に使えない文字を置換
    safe_name = title_str.replace(' ', '_').replace('/', '_')
    filename = f"{safe_name}.png"
    filepath = os.path.join(output_dir, filename)

    # PNGとして保存
    plt.savefig(filepath, dpi=300, bbox_inches='tight')
    print(f"Saved plot as: {filepath}")
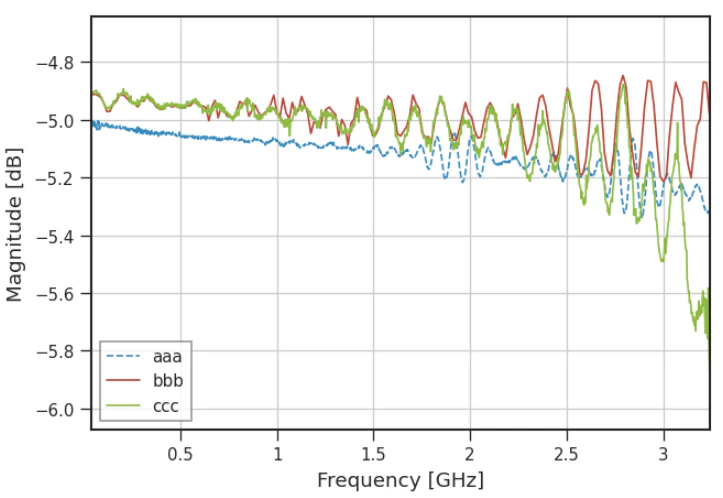
グラフ表示例