概要
ノンパラメトリックなデータの比較の際に箱ひげ図で可視化したメモです。
箱ひげ図の簡単な説明とRのライブラリーであるggplot2を用いて箱ひげ図を書く方法を説明します。
環境
OS X: 10.15.1
RStudio: Version 1.2.5042
箱ひげ図って何?
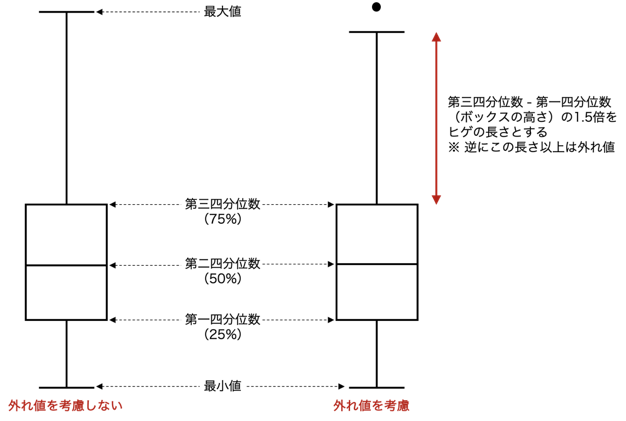
こういうグラフです。
箱ひげ図は一目でデータのばらつき具合判断することができます。
25%ずつの全ての区間(最小値から第一四分位数・第一四分位数から第二四分位・第二四分位から第三四分位・第三四分位から最大値)ごとに同じ数だけデータが入っているので、各区間が狭ければ25%のデータが限られた区間に偏っていることがわかります。
ただし、これは外れ値の考慮がない場合です。
外れ値の考慮がある場合は、ヒゲの長さはボックスの長さ(第三四分位から第一四分位を引いた長さ)の1.5倍になります。
Rのデフォルトも外れ値を考慮したグラフになっているので注意してください。
実際に描いてみる
データの読み込み
今回はcsvファイルを読み込んで、箱ひげ図を書きたいと思います。
子供と大人の被験者に対して、みかんとりんごそれぞれを1~7段階(7が最も好き)のリッカートで評価してもらったシュチュエーションを想定しています。
csvファイルはこんな感じで整形してください(今回はエクセルで適当に作りました)。

カレントディレクトリにあるexample.csvを読み込みます。
data <- read.csv("example.csv")
コピーしてクリップボードのデータを利用したい場合はこのように書くと使えます。
data <- read.table(pipe("pbpaste"))
グラフの描画
# ggplot2をインストール(既にインストールしている人は省略してください)
install.packages("ggplot2")
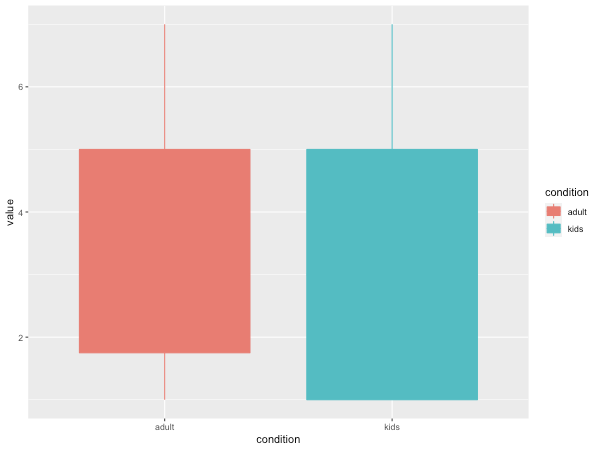
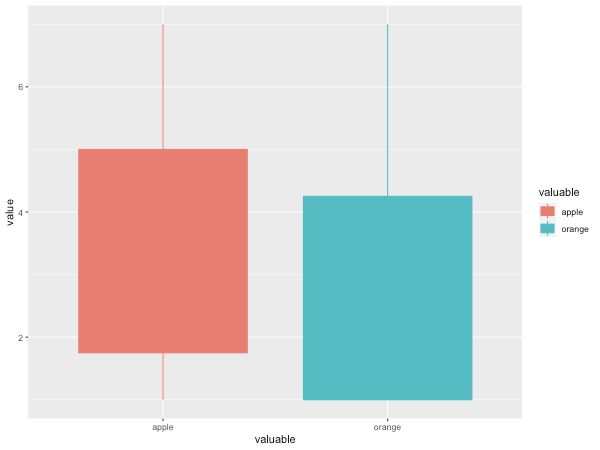
まず、2条件1変数の表示。
xに離散量、yに連続量を入れる必要があります!
# ggplot2の読み込み
library(ggplot2)
# adultsとkidsに分けて箱ひげ図を表示
ggplot(data = data, aes(x =condition , y = value, colour = condition, fill = condition)) + geom_boxplot()
# orangeとappleに分けて箱ひげ図を表示
ggplot(data = data, aes(x = valuable , y = value, colour=valuable,fill= valuable)) + geom_boxplot()
もしも図を出力したい場合はこのように入力します。
# adultsとkidsに分けて箱ひげ図を表示
png("adults_kids.png",600,450)
ggplot(data = data, aes(x = condition , y = value, colour = condition, fill =  condition)) + geom_boxplot()
dev.off()

# orangeとappleに分けて箱ひげ図を表示
png("apple_orange.png",600,450)
ggplot(data = data, aes(x = valuable , y = value, colour=valuable,fill= valuable)) + geom_boxplot()
dev.off()
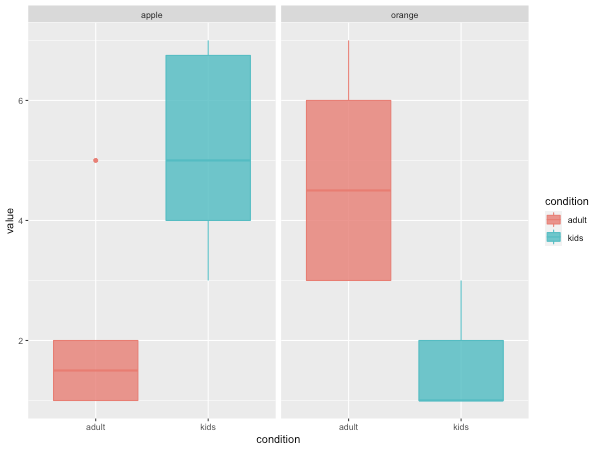
次に2条件2変数の表示。
大人と子供がそれぞれ、「りんご」と「みかん」をどのように評価したかを箱ひげ図で示します。
facet_gridを追加することで、同じY軸X軸に対して、複数変数の図をまとめて表示できます。
png("complex.png",600,450)
ggplot(data = data, aes(x =condition , y = value, colour=condition,fill= condition)) + geom_boxplot(alpha=0.8) + facet_grid(. ~ valuable)
dev.off()
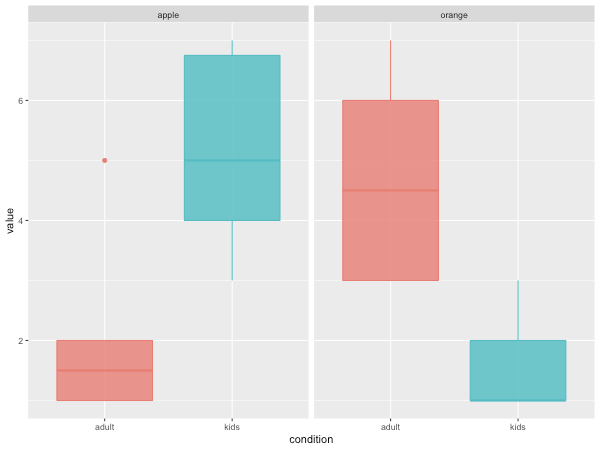
凡例が被っていて特に表示する理由がないので、消します。
参考:https://rstudio.com/wp-content/uploads/2016/10/ggplot2-cheatsheet-2.0-ja.pdf
png("complex_no_theme.png",600,450)
ggplot(data = data, aes(x =condition , y = value, colour=condition,fill= condition)) + geom_boxplot(alpha=0.8) + facet_grid(. ~ valuable) + theme(legend.position="none")
dev.off()
ggplotではデータの色の変更や背景の変更、文字フォント・サイズの変更など様々な修正ができます。
入力まとめ
install.packages("ggplot2")
library(ggplot2)
data <- read.csv("example.csv")
png("complex_no_theme.png",600,450)
ggplot(data = data, aes(x =condition , y = value, colour=condition,fill= condition)) + geom_boxplot(alpha=0.8) + facet_grid(. ~ valuable) + theme(legend.position="none")
dev.off()
