はじめに
PySimpleGUIは名前の通りとても簡単にGUIが作成できて,しかも意外に高機能なGUIが作れます.私は主に研究用のツールを作る目的でPySimpleGUIを使っているのですが,GUIにMatplotlibのグラフを埋め込みたいことがよくあります.この記事ではその方法をまとめています.
この記事の内容は公式のCook BookやGitHubを参考にしています.
この記事で作るもの
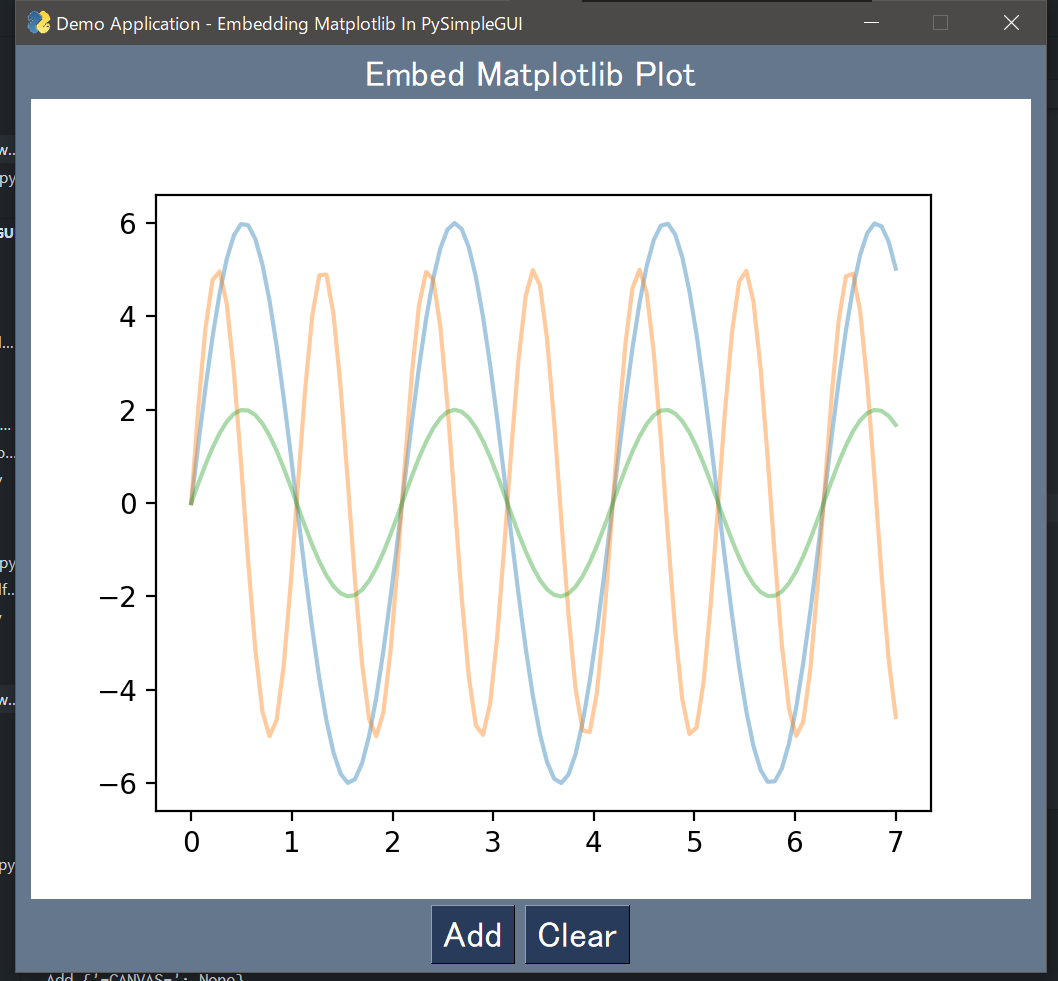
Addボタンを押すたびにランダムなsin波が描画され,Clearボタンでキャンバスを消すことができるだけのシンプルなプログラムです.
インストール
Python 3.8.2 を使用しています.3系であれば問題なく動くと思います.
公式ドキュメントではpipでのインストール方法が書かれていますが,Anacondaでも問題なくインストールできます.私はAnacondaを使っています.
pip install pysimplegui
or
conda install pysimplegui
condaでインストールできなければ
conda install -c conda-forge pysimplegui
を試してみてください.
Matplotlibも使いたいのでインストールします.
conda install matplotlib
プログラム
import numpy as np
import PySimpleGUI as sg
import matplotlib.pyplot as plt
from matplotlib.backends.backend_tkagg import FigureCanvasTkAgg

# GUIがぼやける現象を防ぐための関数
def make_dpi_aware():
  import ctypes
  import platform
  if int(platform.release()) >= 8:
    ctypes.windll.shcore.SetProcessDpiAwareness(True)
make_dpi_aware()

# 描画用の関数
def draw_figure(canvas, figure):
    figure_canvas_agg = FigureCanvasTkAgg(figure, canvas)
    figure_canvas_agg.draw()
    figure_canvas_agg.get_tk_widget().pack(side='top', fill='both', expand=1)
    return figure_canvas_agg

# レイアウト作成
layout = [[sg.Text('Embed Matplotlib Plot')],
          [sg.Canvas(key='-CANVAS-')],
          [sg.Button("Add"), sg.Button("Clear")]]

# windowを作成する.finalize=Trueにする必要がある.
window = sg.Window('Demo Application - Embedding Matplotlib In PySimpleGUI', layout, finalize=True, element_justification='center', font='Monospace 18')

# 埋め込む用のfigを作成する.
fig = plt.figure(figsize=(5, 4))
ax = fig.add_subplot(111)
ax.set_ylim(-10, 10)

# figとCanvasを関連付ける.
fig_agg = draw_figure(window['-CANVAS-'].TKCanvas, fig)

# イベントループ
while True:
    event, values = window.read()
    print(event, values)
    # sg.Print(event, values)

    if event in (None, "Cancel"):
        break

    elif event == "Add":
        # 適当なプロット用データ作成
        t = np.linspace(0, 7, 100)
        afreq = np.random.randint(1, 10)
        amp = np.random.randint(1, 10)
        y = amp * np.sin(afreq * t)

        # プロット
        ax.plot(t, y, alpha=0.4)

        # 変更を加えたあと,fig_agg.draw()で変更を反映させる.
        fig_agg.draw()

    elif event == "Clear":
        ax.cla()
        fig_agg.draw()

# ウィンドウを閉じる.
window.close()
解説
PySimpleGUIの基本的な部分については,公式ドキュメントなどを参照してください.
ウィンドウの解像度が荒い問題
本題とは関係ありませんが,PySimpleGUIでウィンドウを表示したとき,解像度が荒くなって見ずらくなることがあります.その解決策としてmake_dpi_aware関数をプログラムの最初に実行しています.環境によってはこれがなくても問題なく表示されるようです.私はPySimpleGUIのプログラムの最初に必ずこの処理を書くようにしています.詳しくはこのGitHub Issueを見てみてください.
def make_dpi_aware():
  import ctypes
  import platform
  if int(platform.release()) >= 8:
    ctypes.windll.shcore.SetProcessDpiAwareness(True)
Matplotlibプロットを埋め込む
こちらが本題です.
まずウィンドウを作成します.ここで重要なのはプロット埋め込み用のエレメントとしてCanvasを使うこと,そしてウィンドウを作成時にはfinalize=Trueを指定することです.
# レイアウト作成
layout = [[sg.Text('Embed Matplotlib Plot')],
          [sg.Canvas(key='-CANVAS-')],
          [sg.Button("Add"), sg.Button("Clear")]]

# windowを作成する.finalize=Trueにする必要がある.
window = sg.Window('Demo Application - Embedding Matplotlib In PySimpleGUI', layout, finalize=True, element_justification='center', font='Monospace 18')
次に埋め込みたいプロットを普段通り作成します.
fig = plt.figure(figsize=(5, 4))
ax = fig.add_subplot(111)
ax.set_ylim(-10, 10)
次に作成したプロットとCanvasエレメントを紐付けます.draw_figure関数の返り値はあとで必要になります.
# figとCanvasを関連付ける.
fig_agg = draw_figure(window['-CANVAS-'].TKCanvas, fig)
ここで使われているdraw_figure関数は次のようになっています.基本的にこの関数の中身を変える必要はなく,このままコピペして使用可能です.使用時にはプログラムの4行目にあるようにFigureCanvasTkAggのインポートが必要です.
def draw_figure(canvas, figure):
    figure_canvas_agg = FigureCanvasTkAgg(figure, canvas)
    figure_canvas_agg.draw()
    figure_canvas_agg.get_tk_widget().pack(side='top', fill='both', expand=1)
    return figure_canvas_agg
ここまでで埋め込みは完了です.
プロットを更新する
作成したプログラムでは,Addボタンを押すとプロットにsin波が追加されます.このようにプロットを更新するためには,まずax.plot()を実行し,プロットの変更を反映させるためにfig_agg.draw()を実行します.
        # 適当なプロット用データ作成
        t = np.linspace(0, 7, 100)
        afreq = np.random.randint(1, 10)
        amp = np.random.randint(1, 10)
        y = amp * np.sin(afreq * t)

        # プロット
        ax.plot(t, y, alpha=0.4)

        # 変更を加えたあと,fig_agg.draw()で変更を反映させる.
        fig_agg.draw()
