石手川ダムリアルタイムデータ
http://www1.river.go.jp/cgi-bin/DspDamData.exe?ID=1368080150020&KIND=3&PAGE=0
from urllib.parse import urljoin

import pandas as pd
import requests
from bs4 import BeautifulSoup

def fetch_soup(url, parser="html.parser"):

    r = requests.get(url)
    r.raise_for_status()

    soup = BeautifulSoup(r.content, parser)

    return soup


url = "http://www1.river.go.jp/cgi-bin/DspDamData.exe?ID=1368080150020&KIND=3&PAGE=0"

soup = fetch_soup(url)

link = urljoin(url, soup.select_one("body > center > p > a").get("href"))


def dateparse(s):
    date, time = s.split()
    result = pd.to_datetime(date) + pd.to_timedelta(time + ":00")
    return result


df = pd.read_csv(
    link,
    skiprows=9,
    encoding="cp932",
    names=[
        "年月日",
        "時刻",
        "流域平均雨量",
        "流域平均雨量属性",
        "貯水量",
        "貯水量属性",
        "流入量",
        "流入量属性",
        "放流量",
        "放流量属性",
        "貯水率",
        "貯水率属性",
    ],
    parse_dates={"日時": ["年月日", "時刻"]},
    date_parser=dateparse,
    index_col=["日時"],
)

df
pd.options.plotting.backend = "plotly"
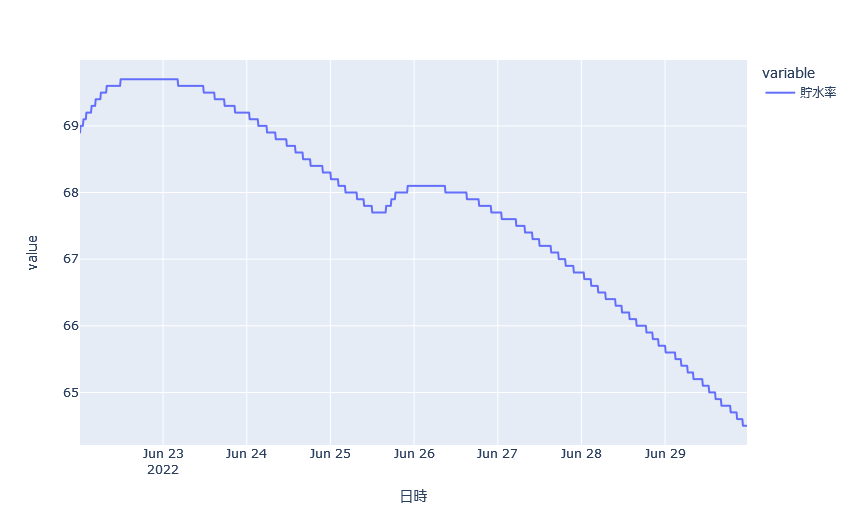
df["貯水率"].plot()