import pandas as pd

url = "https://www.matsuyama-waterworks.jp/water/data/data.csv"

df0 = pd.read_csv(
    url,
    encoding="cp932",
    header=None,
    index_col=[0, 1],
)

df0

df0.iloc[1] = df0.iloc[1].replace({"平成6年度": 1994, "令和3年度": 2021, "令和4年度": 2022})
col = df0.iloc[:2].fillna(method="ffill", axis=1).values
df0.columns = pd.MultiIndex.from_arrays(col)
df0.index.names = ["month", "day"]

df1 = df0.iloc[2:].copy()
df1

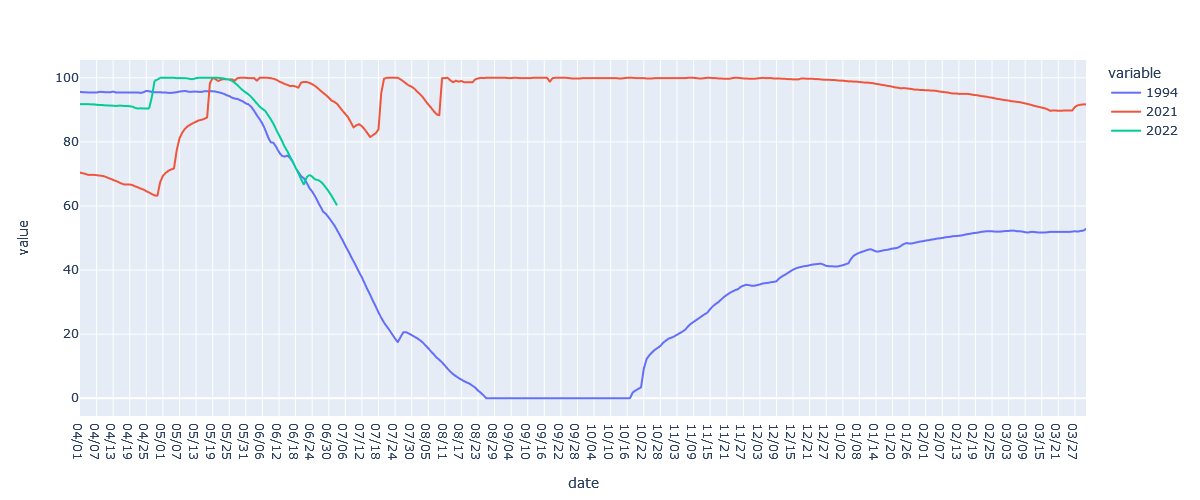
# 貯水率

df2 = df1.loc[:, "石手川ダム貯水率[%]"].astype(float)
df2.columns.name = "year"
df2["date"] = df2.index.map(lambda x: "{0[0]:02}/{0[1]:02}".format(list(map(int, x))))

df2
