目的
Pythonでのmatplotlibを使ったグラフ描画の基礎をひと通りやってみたので備忘録として。
これから機械学習をやりたい人、論文執筆用に簡単にきれいにグラフ作成したい人にも。
matplotlibを使って出来ること
グラフの描画。
エクセルのグラフと同じようなグラフが作成できる。
PythonモジュールのPandasのDataFrame形式(行列形式)のデータを描画するために使われることが多い。
もととなるデータはあらかじめnumpyやPandasで整形してから行うのが機械学習での実践的な使い方。
今回はnumpyとpandasは使わず、簡単なデータを自作して、matplotlibで描画した。
作成するグラフ
- グラフ要素
- 折れ線グラフ
- 棒グラフ
- 棒グラフ(2系列)
- 散布図
- ヒストグラム
- 複合グラフ
- グラフを図として保存
なおJupyter notebook での記述形式を示す。
グラフ要素
グラフの要素の指定方法。
以下を指定する。
- 軸ラベル
- 凡例
- サブプロットタイトル(後述)
- グラフタイトル
# 軸ラベル、凡例、サブプロットタイトル、グラフタイトルの記述方法
%matplotlib inline #インラインで描画を表示するためのコマンド

import matplotlib.pyplot as plt

import matplotlib.style
# グラフスタイル指定
matplotlib.style.use("ggplot")


fig, axes = plt.subplots(ncols=2)

# 凡例の表示
axes[0].plot([1, 2, 3],
             [2, 4, 9],
             label = "legend label")
axes[0].legend(loc = "best") #凡例を表示


# 描画オブジェクトとサブプロットのタイトル
axes[0].set_title("0 graph")
axes[1].set_title("1 graph")
fig.suptitle("fig title")

# 軸ラベル
axes[0].set_xlabel("x0 label")
axes[0].set_ylabel("y0 label")

axes[1].set_xlabel("x1 label")
# axes[1].set_ylabel("y1 label")


plt.show()
折れ線グラフ
ポイント
- matplotlibでの描画には2つの描画スタイルがある
- MATLABスタイル
- 描画オブジェクト(fig)に対してグラフを描画する。
- オブジェクト指向スタイル
- 描画オブジェクトに(fig)対して、サブプロットを追加して、サブプロットに対してグラフを描画する
- ひとつの描画オブジェクトに複数のサブプロットを指定できる
以降はオブジェクト指向スタイルにて記述する。
※ソース中のグラフスタイルは、グラフの背景色や補助目盛などのスタイル。
matplotlib公式のドキュメントにスタイル一覧があるので、発表資料用や論文用など目的に応じたスタイルを指定する。
%matplotlib inline #インラインで描画を表示するためのコマンド

import matplotlib.pyplot as plt

import matplotlib.style
# グラフスタイル指定
matplotlib.style.use("ggplot")


# オブジェクト指向スタイル描画
# 描画オブジェクトに対して、サブプロットを追加して、サブプロットに対してグラフを描画する
# ひとつの描画オブジェクトに複数のサブプロットを指定できる。

# 入力データ
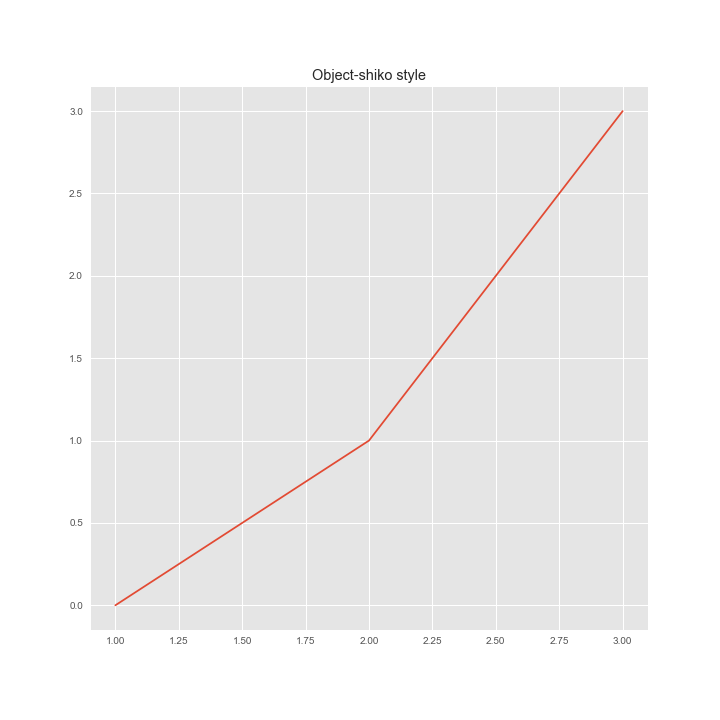
x = [1, 2, 3]
y = [0, 1, 3]

# 描画オブジェクト(fig)とサブプロット(ax)生成
fig, ax = plt.subplots()

ax.plot(x, y) #折れ線グラフ描画
ax.set_title("Object-shiko style") #サブプロットにタイトルを設定 日本語文字化けする

plt.show() #グラフ描画
棒グラフ
棒グラフ描画方法
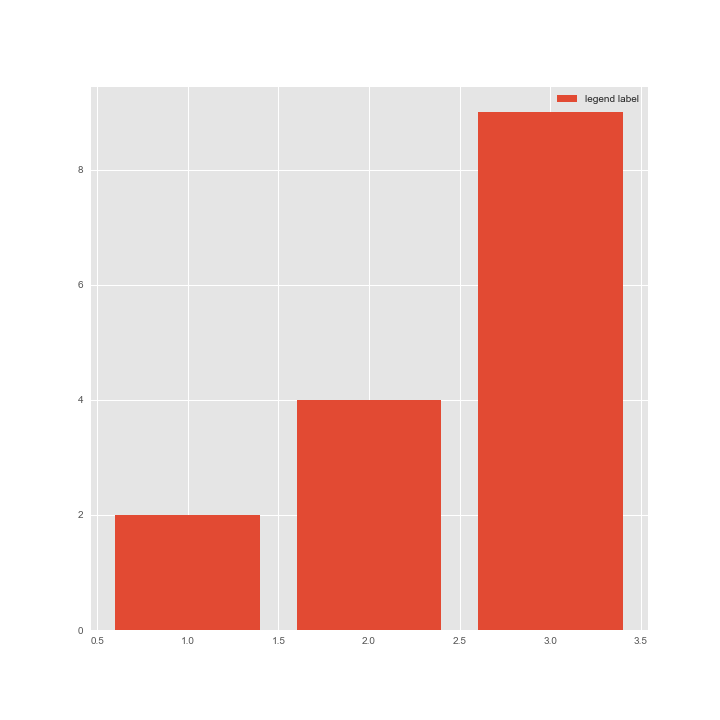
fig, axes = plt.subplots()

# 凡例の表示
axes.bar([1, 2, 3],
             [2, 4, 9],
             label = "legend label")
axes.legend(loc = "best") #凡例を表示
plt.show()
棒グラフ(2系列)
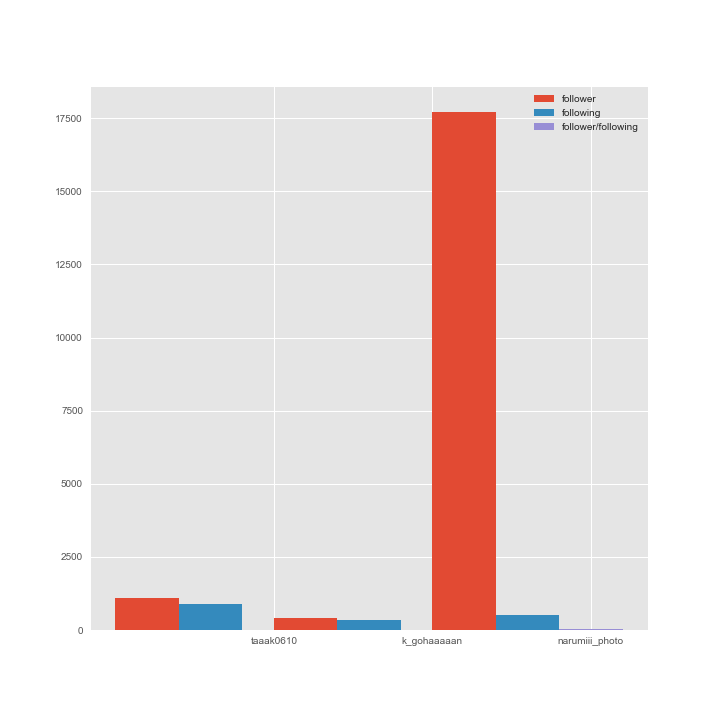
ポイント:棒グラフの幅を指定。2系列並べるため、系列のx座標をずらす。
fig, axes = plt.subplots()

x= [1, 2, 3]
y1= [1090, 420, 17.7e+3] #follower
y2= [890, 348, 499]#following
y3= [y1[0]/y2[0],  y1[1]/y2[1], y1[2]/y2[2]]


tick_labels = ["taaak0610", "k_gohaaaaan", "narumiii_photo"]#系列のラベル名
data_label1="follower"#データのラベル名
data_label2="following"
data_label3="follower/following"

width =0.4 #棒グラフの幅を0.4にする

axes.bar(x, y1,width=width, tick_label=tick_labels, label =data_label1) #tick_label 系列ラベル名の指定

x2 = [num + width for num in x]
axes.bar(x2, y2,width=width, tick_label=tick_labels, label =data_label2) #tick_label 系列ラベル名の指定

x3 = [num + width for num in x2]
axes.bar(x3, y3,width=width, tick_label=tick_labels, label =data_label3) #tick_label 系列ラベル名の指定

axes.legend(loc = "best")
plt.show()
散布図
mport numpy as np

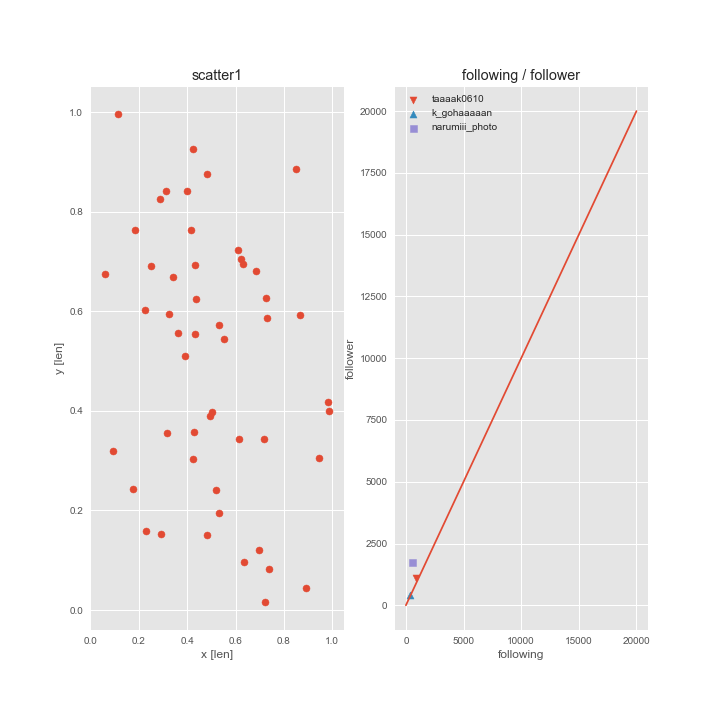
fig, axes = plt.subplots(1,2)

# ランダムに50個の要素を生成
np.random.seed(123)
x = np.random.rand(50)
y = np.random.rand(50)

axes[0].set_title("scatter1")
axes[0].set_xlabel("x [len]")
axes[0].set_ylabel("y [len]")
axes[0].scatter(x, y) #散布図を描画
# axes[0].axis("equal")

axes[1].set_title("following / follower")
axes[1].set_xlabel("following")
axes[1].set_ylabel("follower")
axes[1].scatter(y2[0], y1[0],
                marker="v", label="taaaak0610" ) #散布図を描画
axes[1].scatter(y2[1], y1[1],
                marker="^", label="k_gohaaaaan" )
axes[1].scatter(y2[2], y1[2],
                marker="s", label="narumiii_photo" )

axes[1].plot([0,20000],[0,20000])
axes[1].legend(loc="best")
# axes[1].axis("equal")

plt.show()
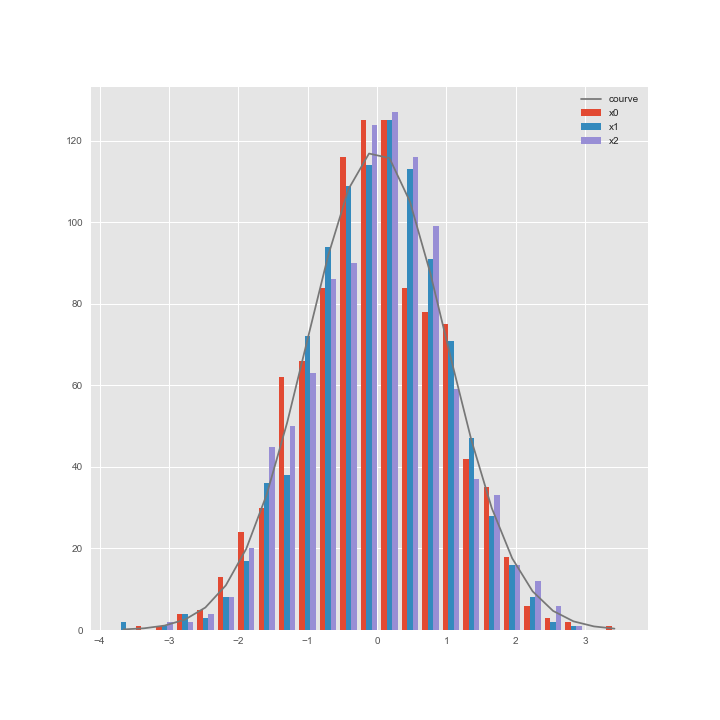
ヒストグラム
fig, ax = plt.subplots()

# ランダムに50個の要素を生成
np.random.seed(123)
x0 = np.random.randn(1000)#正規乱数を生成
x1 = np.random.randn(1000)#正規乱数を生成
x2 = np.random.randn(1000)#正規乱数を生成

# ヒストグラムを描画
counts, edges, patches = ax.hist((x0,x1,x2), bins=25, label=("x0", "x1", "x2"))

x_fit= (edges[:-1] + edges[1:]) / 2

# 近似曲線
y =1000*np.diff(edges) * np.exp(-x_fit**2 / 2)/np.sqrt(2*np.pi)
ax.plot(x_fit, y, label="courve")
ax.legend()

plt.show()
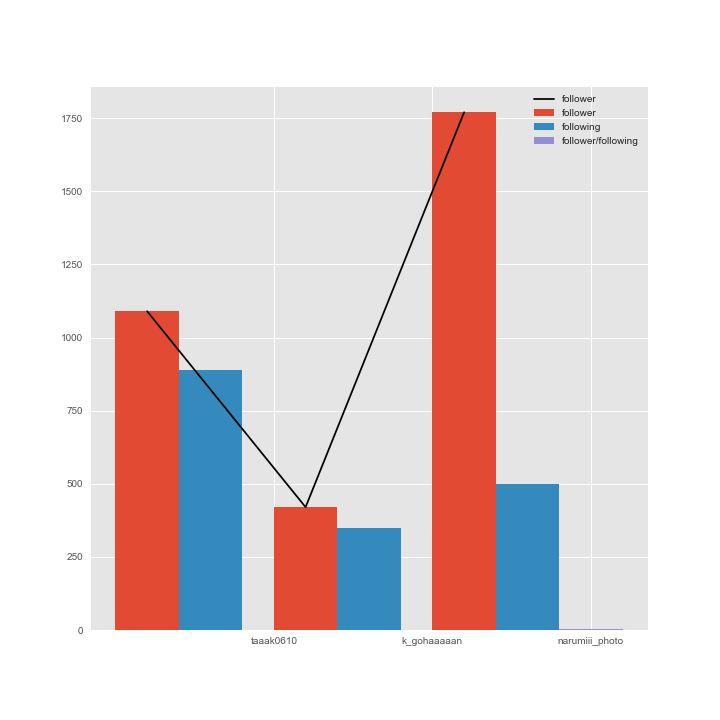
複合グラフ
fig, axes = plt.subplots()

x= [1, 2, 3]
y1= [1090, 420, 1770] #follower
y2= [890, 348, 499]#following
y3= [y1[0]/y2[0],  y1[1]/y2[1], y1[2]/y2[2]]


tick_labels = ["taaak0610", "k_gohaaaaan", "narumiii_photo"]#系列のラベル名
data_label1="follower"#データのラベル名
data_label2="following"
data_label3="follower/following"

width =0.4 #棒グラフの幅を0.4にする

axes.bar(x, y1,width=width, tick_label=tick_labels, label =data_label1) #tick_label 系列ラベル名の指定
axes.plot(x, y1, label= "follower", color="black")

x2 = [num + width for num in x]
axes.bar(x2, y2,width=width, tick_label=tick_labels, label =data_label2) #tick_label 系列ラベル名の指定

x3 = [num + width for num in x2]
axes.bar(x3, y3,width=width, tick_label=tick_labels, label =data_label3) #tick_label 系列ラベル名の指定

axes.legend(loc = "best")
# plt.figure(figsize=(0.05, 0.05), dpi=50)
plt.show()
グラフを図として保存
グラフ領域(fig)を図として保存する。
# グラフをファイル出力 savefigメソッド

fig, axes = plt.subplots(ncols=2)

# 凡例の表示
axes[0].plot([1, 2, 3],
             [2, 4, 9],
             label = "legend label")
axes[0].legend(loc = "best") #凡例を表示


# 描画オブジェクトとサブプロットのタイトル
axes[0].set_title("0 graph")
axes[1].set_title("1 graph")
fig.suptitle("fig title")

# 軸ラベル
axes[0].set_xlabel("x0 label")
axes[0].set_ylabel("y0 label")

axes[1].set_xlabel("x1 label")

# グラフをファイル出力 savefigメソッド
# 画像系の拡張子は大体対応している。
fig.savefig("savefig01.png")
fig.savefig("savefig02.jpeg")
参考文献
Python によるあたらしいデータ分析の教科書
著者:寺田学 他
出版:株式会社翔泳社 2018年
url:https://www.shoeisha.co.jp/book/detail/9784798158341
Help!
画像サイズを横に伸ばそうといろいろいじってたら、アスペクト比戻せなくなりました。
誰か助けて!
おわり
