本記事で行うこと
関連性のある2つのJSONデータをもとに表を2つAutonomous Databaseに作成し、その2つの表を結合操作することで簡単なデータ分析を行ってみたいと思います。
JSONデータを結合して、データ分析をしてみる
-
まず1つめのJSONデータはOracle Live Labs内のLab4からダウンロードできるものを使います。
-
手順に沿って、AirportDelays.jsonをダウンロードし、Autonomous Databaseにロードします。
-
このデータはアメリカの空港の場所や、2003~2016年の飛行機の発着数、遅延の分数などのサンプルデータが格納されています。
-
2つめのJSONデータを作成し、Autonomous Database内に表として格納します。
-
表を作成します。
CREATE TABLE weather_json_data ( id NUMBER GENERATED ALWAYS AS IDENTITY PRIMARY KEY, -- 自動増加 ID json_data CLOB CHECK (json_data IS JSON) -- JSON 格納用カラム ); -
weather_json_data表にサンプルのデータをINSERTします。
INSERT INTO weather_json_data (json_data) VALUES (' [ { "AirportCode": "ATL", "Year": 2003, "Month": 6, "AverageTemperature": 27.3, "TotalPrecipitation": 95.2, "AverageWindSpeed": 15.5 }, { "AirportCode": "BOS", "Year": 2003, "Month": 6, "AverageTemperature": 22.1, "TotalPrecipitation": 120.4, "AverageWindSpeed": 13.5 }, { "AirportCode": "BWI", "Year": 2003, "Month": 6, "AverageTemperature": 24.8, "TotalPrecipitation": 110.3, "AverageWindSpeed": 12.7 }, { "AirportCode": "CLT", "Year": 2003, "Month": 6, "AverageTemperature": 26.4, "TotalPrecipitation": 85.6, "AverageWindSpeed": 10.9 }, { "AirportCode": "DCA", "Year": 2003, "Month": 6, "AverageTemperature": 25.2, "TotalPrecipitation": 99.8, "AverageWindSpeed": 14.1 } ]'); -
2003年6月の複数の空港があるエリアの平均気温、降水量、平均風速のデータを登録しました。このデータはダミーです。
-
AirportDelays表と、作成したweather_json_data表を結合してデータ分析をしてみます。
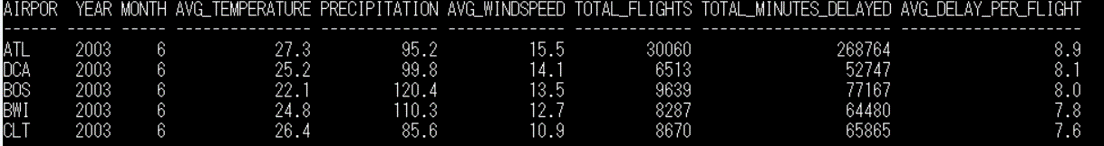
SET LINESIZE 200
SET PAGESIZE 50
SET NULL 'NULL'
COLUMN AirportCode FORMAT A6
COLUMN Year FORMAT 9999
COLUMN Month FORMAT 99
COLUMN Avg_Temperature FORMAT 999.9
COLUMN Precipitation FORMAT 999.9
COLUMN Avg_WindSpeed FORMAT 999.9
COLUMN Total_Flights FORMAT 99999999
COLUMN Total_Minutes_Delayed FORMAT 99999999
COLUMN Avg_Delay_Per_Flight FORMAT 999.9

SELECT
    d.AirportCode,
    TO_NUMBER(JSON_VALUE(d.Time, '$.Year')) AS Year,
    TO_NUMBER(JSON_VALUE(d.Time, '$.Month')) AS Month,
    ROUND(AVG(w.AverageTemperature), 1) AS Avg_Temperature,
    ROUND(AVG(w.TotalPrecipitation), 1) AS Precipitation,
    ROUND(AVG(w.AverageWindSpeed), 1) AS Avg_WindSpeed,
    SUM(TO_NUMBER(JSON_VALUE(d.Statistics, '$.Flights.Total'))) AS Total_Flights,
    SUM(TO_NUMBER(JSON_VALUE(d.Statistics, '$."Minutes Delayed"."Total"'))) AS Total_Minutes_Delayed,
    ROUND(SUM(TO_NUMBER(JSON_VALUE(d.Statistics, '$."Minutes Delayed"."Total"')))
          / NULLIF(SUM(TO_NUMBER(JSON_VALUE(d.Statistics, '$.Flights.Total'))), 0), 1) AS Avg_Delay_Per_Flight
FROM airportdelays d
LEFT JOIN (
    SELECT
        jt.AirportCode,
        jt.Year,
        jt.Month,
        jt.AverageTemperature,
        jt.TotalPrecipitation,
        jt.AverageWindSpeed
    FROM weather_json_data w,
        JSON_TABLE(
            w.json_data, '$[*]'
            COLUMNS (
                AirportCode VARCHAR2(10) PATH '$.AirportCode',
                Year NUMBER PATH '$.Year',
                Month NUMBER PATH '$.Month',
                AverageTemperature NUMBER(5,2) PATH '$.AverageTemperature',
                TotalPrecipitation NUMBER(6,2) PATH '$.TotalPrecipitation',
                AverageWindSpeed NUMBER(5,2) PATH '$.AverageWindSpeed'
            )
        ) jt
) w
ON UPPER(d.AirportCode) = UPPER(w.AirportCode)
AND TO_NUMBER(JSON_VALUE(d.Time, '$.Year')) = w.Year
AND TO_NUMBER(JSON_VALUE(d.Time, '$.Month')) = w.Month
WHERE w.AverageTemperature IS NOT NULL
GROUP BY d.AirportCode, TO_NUMBER(JSON_VALUE(d.Time, '$.Year')), TO_NUMBER(JSON_VALUE(d.Time, '$.Month'))
ORDER BY Year, Month, Avg_Delay_Per_Flight DESC;
結果を確認すると、今回は恣意的にデータを作成しましたが、風速が速いエリアにある空港ほど、1フライト当たりの平均遅延分数が多いことが分かります。