はじめに
昨今、赤色や青色のアメリカ地図をよくニュースで見かけますが、MATLABでそのような地図をどう作るのでしょうか。政治がらみの記事にはしたくないので、私の過去を振り返るネタで書きたいと思います。
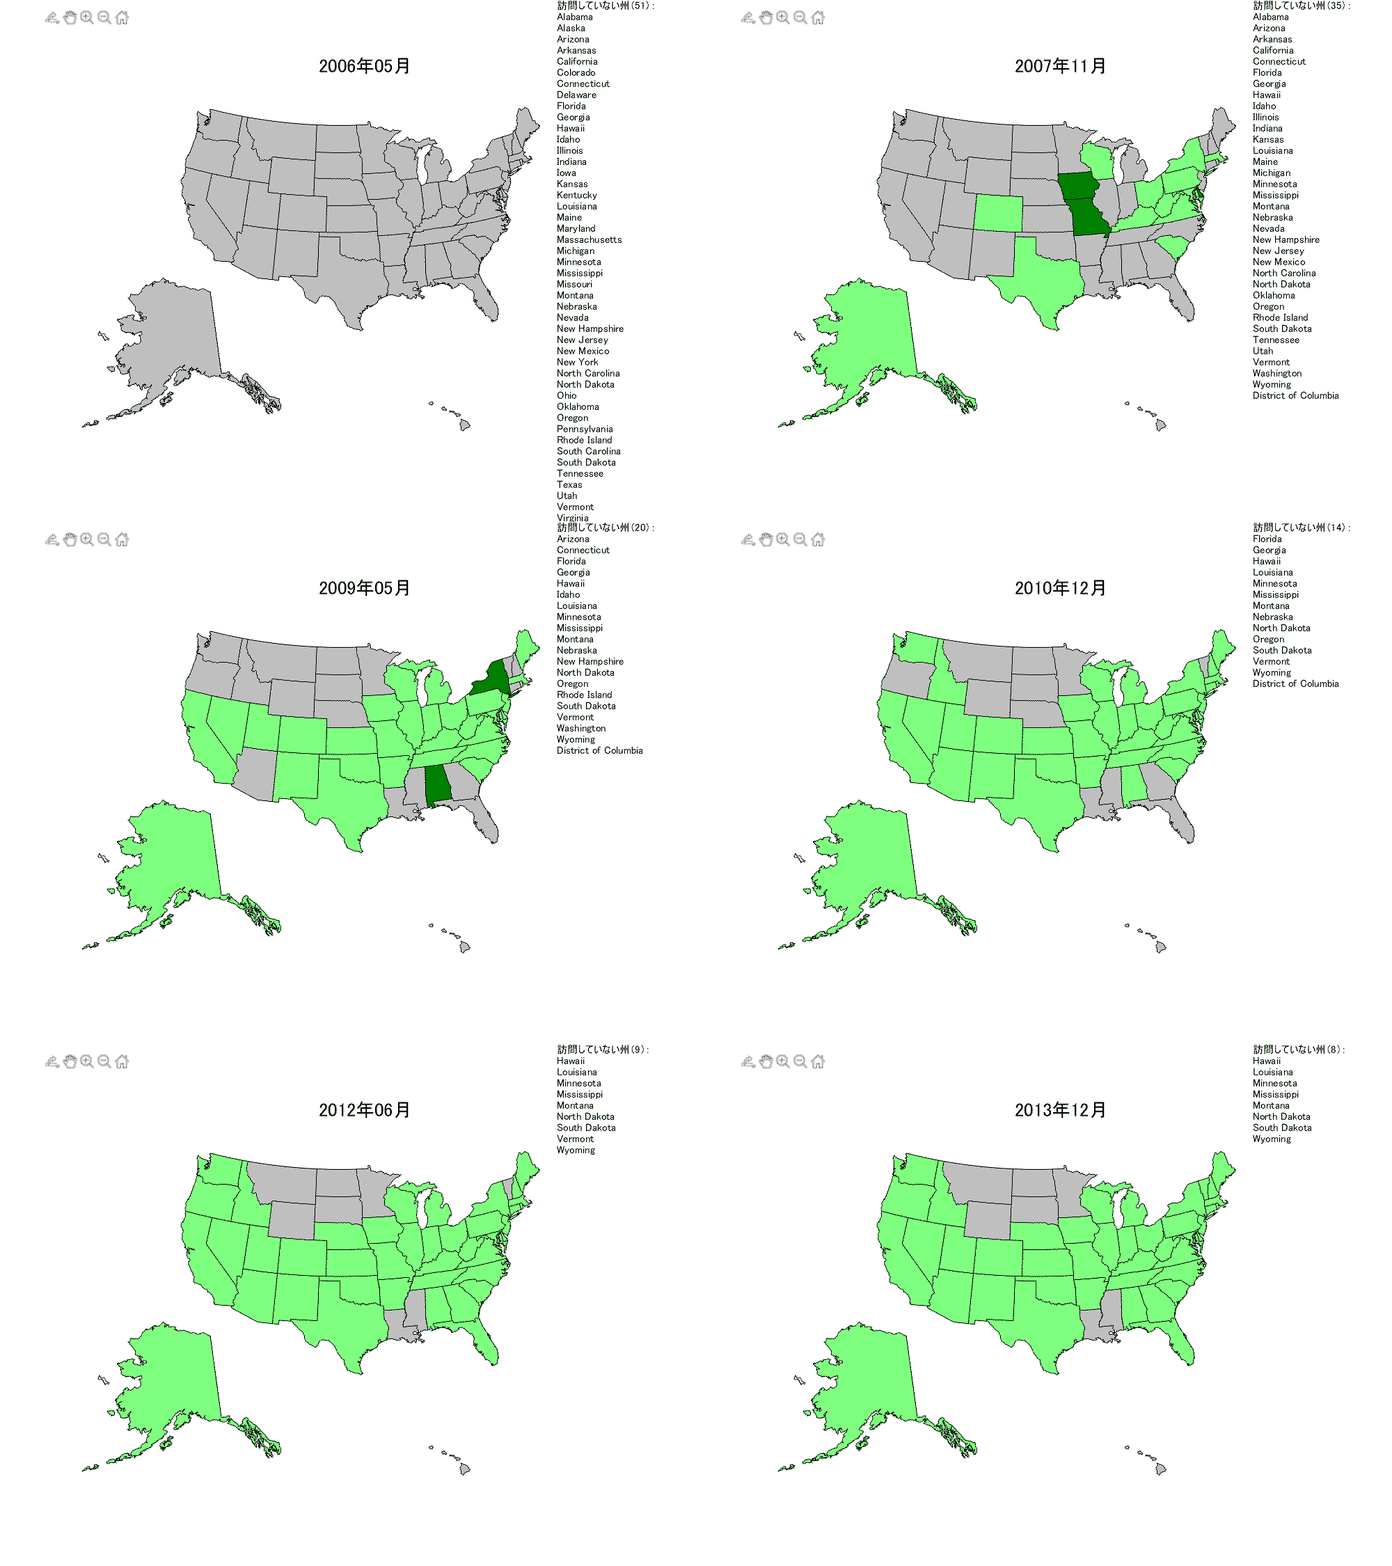
以前、アメリカの本社でアプリケーションエンジニアをしていた頃、出張で全国を飛び回っていました。実際どの州を訪問したか可視化してみることにしました。
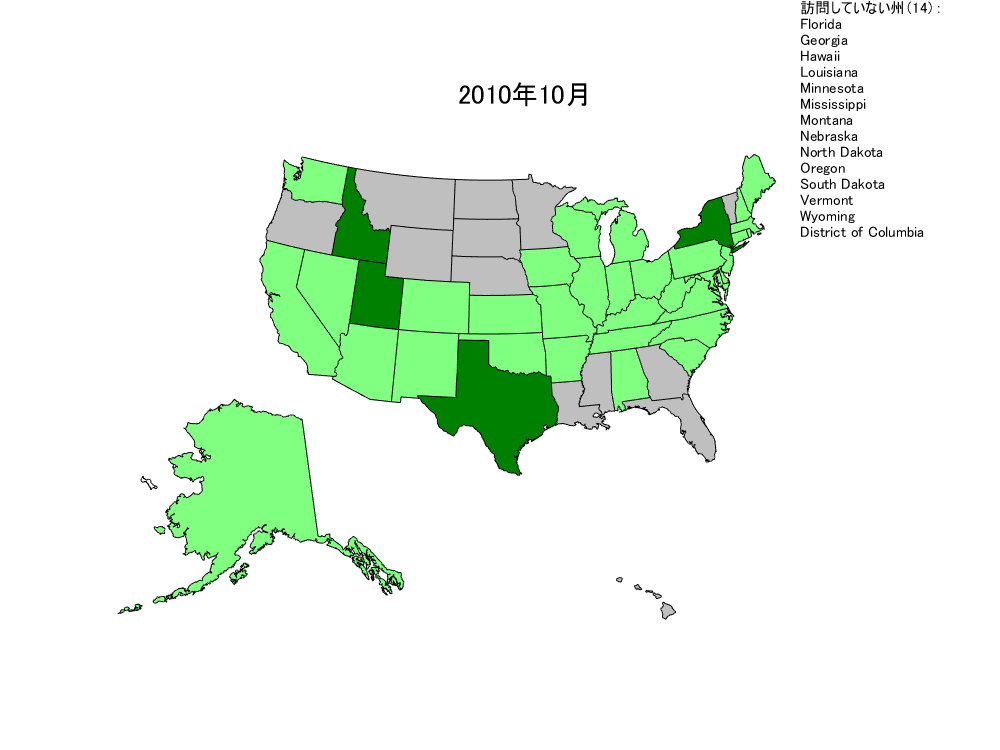
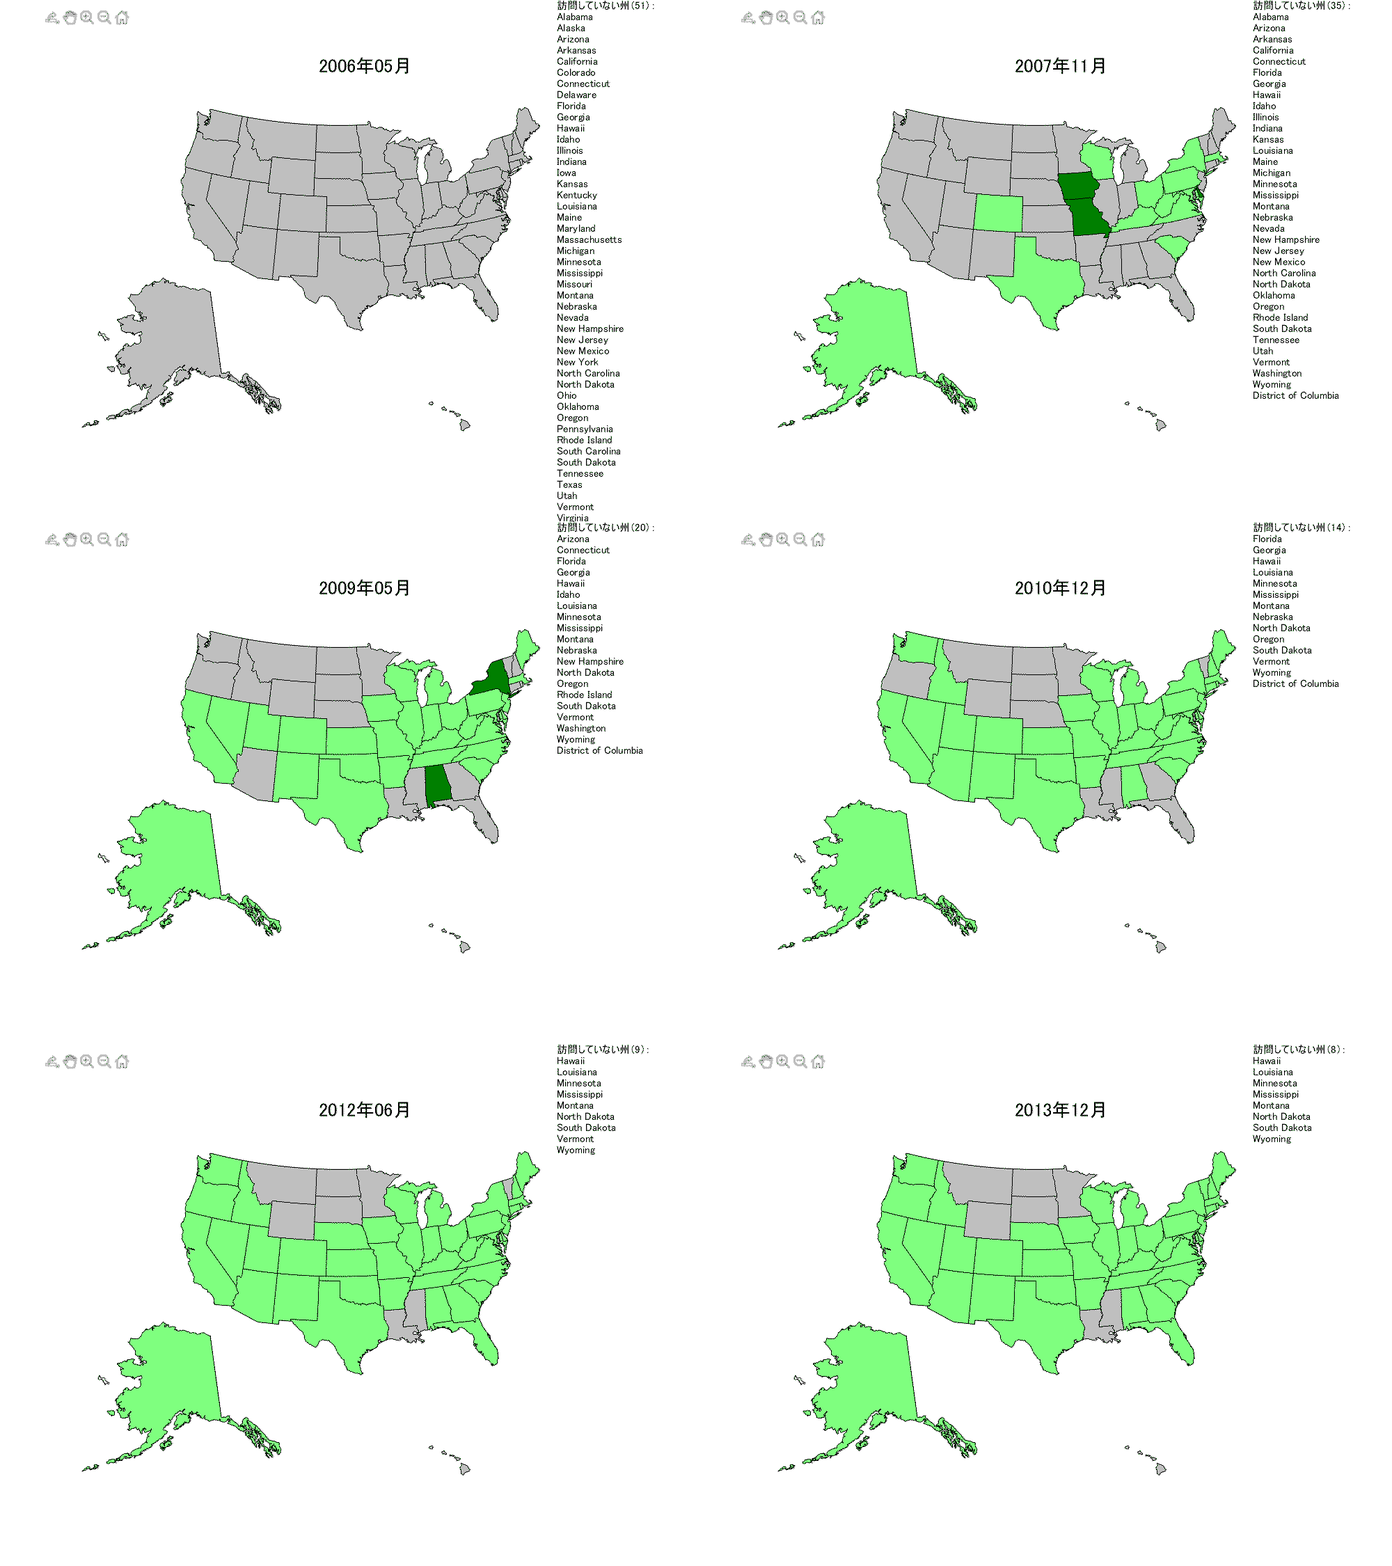
今回はこのアニメーションの作成方法について解説します。
Mapping Toolbox
地図上に色付きのパッチを表示するために Mapping Toolbox を活用しました。主に使った機能はこちらの3つ。
- 地図データ(州の境界線の地図座標)をシェープファイルから読み込む
shaperead関数 - アメリカのMap axesを作成する
usamap関数(世界の場合worldmap関数を使う) - 色付きパッチを表示する
geoshow関数
あとは、出張の訪問履歴から州情報を抜き出し、対応する州を色付けし、ループでグラフィックスをアップデートします。
出張データ
visitData = readtable("VisitedStates.xlsx","Sheet","Sheet2","TextType","string");
こんな感じでExcelデータを用意しました。
visitData(1:10,:)
| Date | State | |
|---|---|---|
| 1 | 2012/01/18 | "Massachusetts" |
| 2 | 2012/02/15 | "Tennessee" |
| 3 | 2012/03/05 | "Pennsylvania" |
| 4 | 2012/03/07 | "Pennsylvania" |
| 5 | 2012/03/09 | "Canada" |
| 6 | 2012/03/21 | "Pennsylvania" |
| 7 | 2012/03/27 | "Virginia" |
| 8 | 2012/04/19 | "Ohio" |
| 9 | 2012/05/02 | "Illinois" |
| 10 | 2012/05/21 | "Washington" |
後々、処理しやすいように、日付を月始めに調整します。
visitData.Date = dateshift(visitData.Date,'start','month');
visitData(1:10,:)
| Date | State | |
|---|---|---|
| 1 | 2012/01/01 | "Massachusetts" |
| 2 | 2012/02/01 | "Tennessee" |
| 3 | 2012/03/01 | "Pennsylvania" |
| 4 | 2012/03/01 | "Pennsylvania" |
| 5 | 2012/03/01 | "Canada" |
| 6 | 2012/03/01 | "Pennsylvania" |
| 7 | 2012/03/01 | "Virginia" |
| 8 | 2012/04/01 | "Ohio" |
| 9 | 2012/05/01 | "Illinois" |
| 10 | 2012/05/01 | "Washington" |
地図データの準備
地図データの描画はほぼ Mapping Toolbox で行いました。
まずはアメリカの州の境界線データをMapping Toolboxに含まれているシェープファイルから読み取ります。usastatelo.shp にはアメリカの50州+Washington D.C.の境界線の座標データ(緯度、経度)が含まれています。
states = shaperead("usastatelo","UseGeoCoords",true);

% 州名を抽出
names = string({states.Name});

% アラスカとハワイは別軸に表示されるため、それぞれのインデックスを取得
indexAlaska = names == "Alaska";
indexHawaii = names == "Hawaii";
次に、使う色を指定します。まだ訪問していない州、訪問済みの州、今回訪問した州、の3種類の色をしていします。
haveBeenColor = [.5 1 .5];
justHaveBeenColor = [0 .5 0];
haveNotBeenColor = [.75 .75 .75];
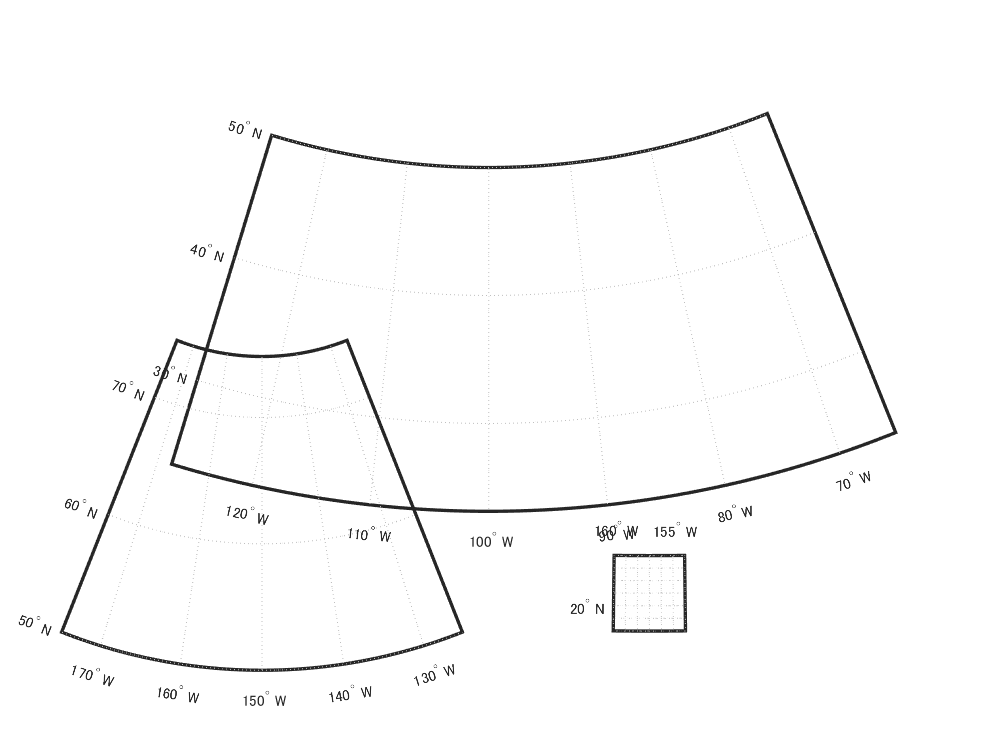
まずアメリカの map axes を用意するのですが、Toolboxにある usamap 関数を使います。
hFig = figure("Units","pixels","Position",[100 100 800 600],...
  "Color","white");
hAx = usamap("all");
地図の描画
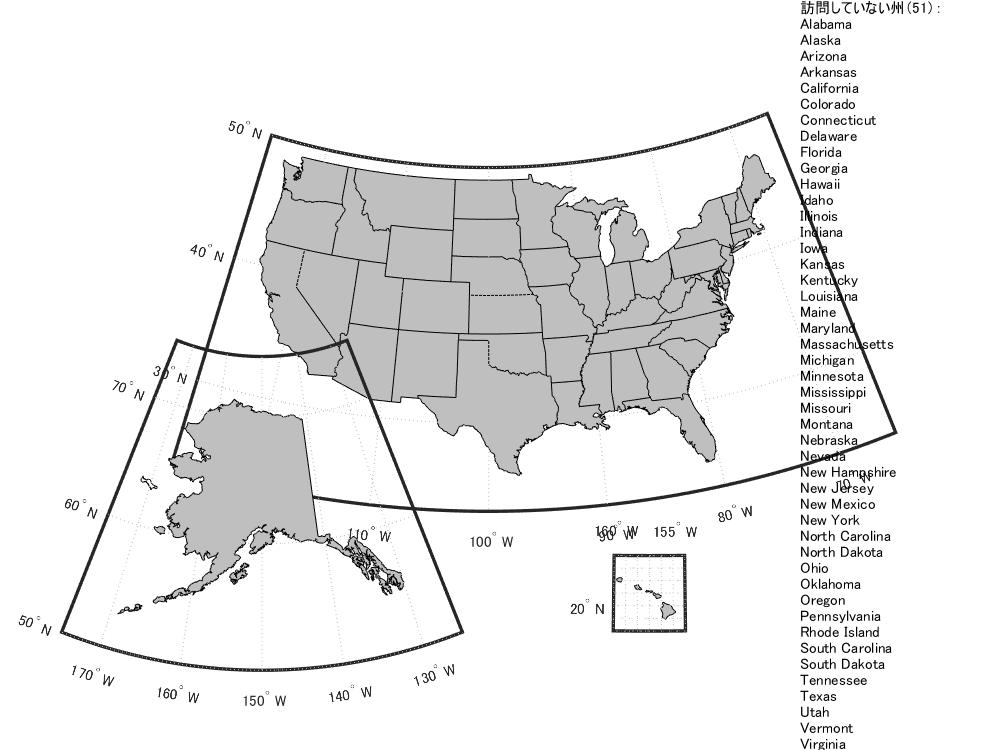
次に geoshow 関数で州の境界線を描きます。最初の軸にはハワイとアラスカ以外の州を、2つ目の軸にはアラスカを、3つ目の軸にはハワイを描きます。
hMain = geoshow(hAx(1),states(~indexHawaii & ~indexAlaska),"FaceColor",haveNotBeenColor);
hAlaska = geoshow(hAx(2),states(indexAlaska),"FaceColor",haveNotBeenColor);
hHawaii = geoshow(hAx(3),states(indexHawaii),"FaceColor",haveNotBeenColor);

hTitle = title(hAx(1),"","FontSize",16);

% 訪問していない州のリスト
hStateList = axes(hFig,"Units","normalized","Position",[0.8 0 0.2 1],"Visible","off");
hStateListText = text(0,1,["訪問していない州(" + length(names) + "):",names], ...
                      "VerticalAlignment","top");
hMainを見てみると、オブジェクトの Children に49のパッチオブジェクトがあるのが分かります。
hMain
hMain =
  Group のプロパティ:

    Children: [49x1 Patch]
     Visible: on
     HitTest: on

  すべてのプロパティ を表示
つまり49州のパッチオブジェクトです。
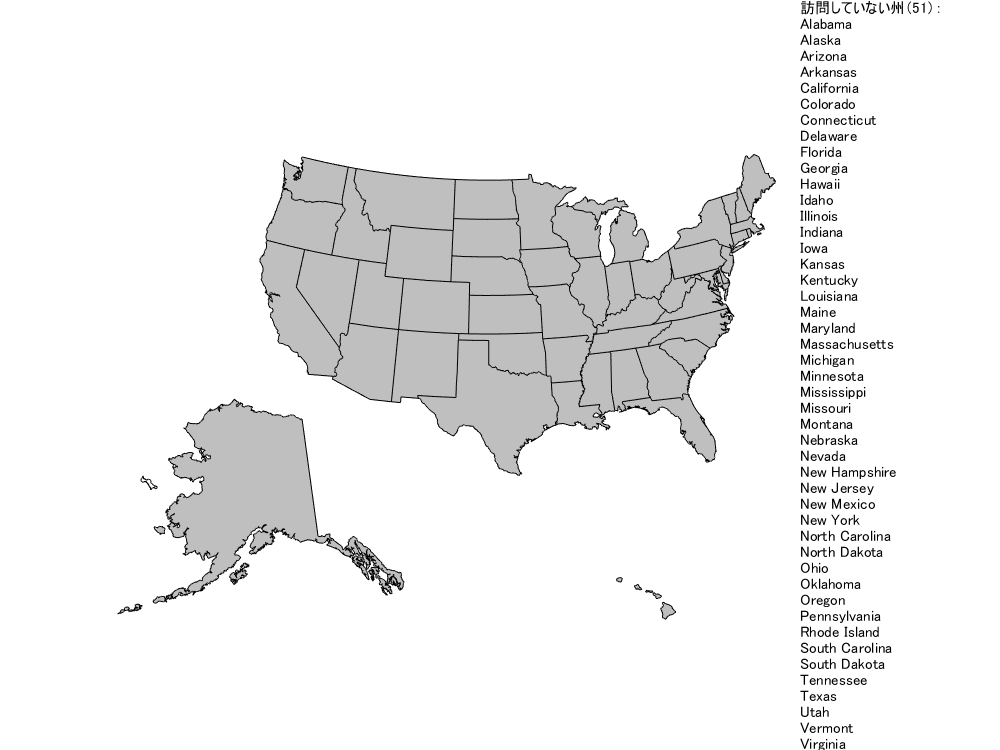
map axes の枠を消しましょう。
for k = 1:length(hAx)
  setm(hAx(k),"Frame","off","Grid","off",...
    "ParallelLabel","off","MeridianLabel","off")
end
訪問した州(訪問してない州)
準備完了です!あとは、for ループで月ごとに地図をアップデートします。
試しに、ある月で見てましょう。例えば2010年10月時点での訪問データを可視化してみます。
cutoffDate = datetime(2010,10,1);
1. 出張データから、ある日付(月)までに訪問した州名を抽出。また、その月に訪問した州名も抽出
goneToStates = unique(visitData.State(visitData.Date < cutoffDate));
justGoneToStates = unique(visitData.State(visitData.Date == cutoffDate));
2. 抽出した州名のインデックスを取得
haveBeenIDX = contains(names, goneToStates);
justHaveBeenIDX = contains(names, justGoneToStates);
haveNotBeenIDX = ~(haveBeenIDX | justHaveBeenIDX);
3. 州に適切な色で色付け
% 訪問していない州
set(hMain.Children(haveNotBeenIDX(~indexHawaii & ~indexAlaska)),...
    "FaceColor",haveNotBeenColor)
set(hAlaska.Children(haveNotBeenIDX(indexAlaska)),"FaceColor",haveNotBeenColor)
set(hHawaii.Children(haveNotBeenIDX(indexHawaii)),"FaceColor",haveNotBeenColor)

% 訪問した州
set(hMain.Children(haveBeenIDX(~indexHawaii & ~indexAlaska)),...
    "FaceColor",haveBeenColor)
set(hAlaska.Children(haveBeenIDX(indexAlaska)),"FaceColor",haveBeenColor)
set(hHawaii.Children(haveBeenIDX(indexHawaii)),"FaceColor",haveBeenColor)

% この月に訪問した州
set(hMain.Children(justHaveBeenIDX(~indexHawaii & ~indexAlaska)),...
    "FaceColor",justHaveBeenColor)
set(hAlaska.Children(justHaveBeenIDX(indexAlaska)),"FaceColor",justHaveBeenColor)
set(hHawaii.Children(justHaveBeenIDX(indexHawaii)),"FaceColor",justHaveBeenColor)
4. タイトルと訪問していない州リストの更新
hTitle.String = char(cutoffDate,"uuuu年MM月");
hStateListText.String = ["訪問していない州(" + nnz(haveNotBeenIDX) + ...
                         "):",names(haveNotBeenIDX)];
完成版
全てをくっつけるとこんな感じになります。
% 出張データ読み込み
visitData = readtable("VisitedStates.xlsx","Sheet","Sheet2","TextType","string");
visitData.Date = dateshift(visitData.Date,'start','month');

% アメリカの州の境界線データ読み込み
states = shaperead("usastatelo","UseGeoCoords",true);

% 州名を抽出
names = string({states.Name});

% アラスカとハワイは別軸に表示されるため、それぞれのインデックスを取得
indexAlaska = names == "Alaska";
indexHawaii = names == "Hawaii";

% 色の定義
haveBeenColor = [.5 1 .5];
justHaveBeenColor = [0 .5 0];
haveNotBeenColor = [.75 .75 .75];

% Map Axesの準備
hFig = figure("Units","pixels","Position",[100 100 800 600],...
  "Color","white");
hAx = usamap("all");

% 州の境界線
hMain = geoshow(hAx(1),states(~indexHawaii & ~indexAlaska),"FaceColor",haveNotBeenColor);
hAlaska = geoshow(hAx(2),states(indexAlaska),"FaceColor",haveNotBeenColor);
hHawaii = geoshow(hAx(3),states(indexHawaii),"FaceColor",haveNotBeenColor);

hTitle = title(hAx(1),"","FontSize",16);

% 訪問していない州のリスト
hStateList = axes(hFig,"Units","normalized","Position",[0.8 0 0.2 1],"Visible","off");
hStateListText = text(0,1,["訪問していない州("+length(names)+"):",names],"VerticalAlignment","top");

% Map Axesの枠削除
for k = 1:length(hAx)
  setm(hAx(k),"Frame","off","Grid","off",...
    "ParallelLabel","off","MeridianLabel","off")
end

% 月ベクトルの定義
monthlist = datetime(2006,5,1):calmonths(1):datetime(2013,12,1);

for idx = 1:length(monthlist)
    cutoffDate = monthlist(idx);

    % 出張データから、ある日付(月)までに訪問した州名を抽出。また、その月に訪問した州名も抽出
    goneToStates = unique(visitData.State(visitData.Date < cutoffDate));      % この月までに訪問した州名
    justGoneToStates = unique(visitData.State(visitData.Date == cutoffDate)); % この月に訪問した州名

    % 抽出した州名のインデックスを取得
    haveBeenIDX = contains(names, goneToStates);
    justHaveBeenIDX = contains(names, justGoneToStates);
    haveNotBeenIDX = ~(haveBeenIDX | justHaveBeenIDX);

    % 州に適切な色で色付け
    % 訪問していない州
    set(hMain.Children(haveNotBeenIDX(~indexHawaii & ~indexAlaska)),"FaceColor",haveNotBeenColor)
    set(hAlaska.Children(haveNotBeenIDX(indexAlaska)),"FaceColor",haveNotBeenColor)
    set(hHawaii.Children(haveNotBeenIDX(indexHawaii)),"FaceColor",haveNotBeenColor)

    % 訪問した州
    set(hMain.Children(haveBeenIDX(~indexHawaii & ~indexAlaska)),"FaceColor",haveBeenColor)
    set(hAlaska.Children(haveBeenIDX(indexAlaska)),"FaceColor",haveBeenColor)
    set(hHawaii.Children(haveBeenIDX(indexHawaii)),"FaceColor",haveBeenColor)

    % この月に訪問した州
    set(hMain.Children(justHaveBeenIDX(~indexHawaii & ~indexAlaska)),"FaceColor",justHaveBeenColor)
    set(hAlaska.Children(justHaveBeenIDX(indexAlaska)),"FaceColor",justHaveBeenColor)
    set(hHawaii.Children(justHaveBeenIDX(indexHawaii)),"FaceColor",justHaveBeenColor)

    % タイトルと訪問していない州リストの更新
    hTitle.String = char(cutoffDate,"uuuu年MM月");
    hStateListText.String = ["訪問していない州(" + nnz(haveNotBeenIDX) + "):",names(haveNotBeenIDX)];

    pause(0.1)
end
最後にもう一度アニメーションを見てみましょう。
これで、データさえあればアメリカの大統領選挙の結果も簡単に可視化できますね!
