よく分かっていないのだけれど、とにかく Juypter notebook で動かして確認してみます。
いずれ深く理解する必要があるときに見た目で確認できるように。
表示のしかけを用意しておく
import numpy as np
import matplotlib.pyplot as plt
np.random.seed(0)

def hist(array):
    fig, ax = plt.subplots()
    n, bins, patches = ax.hist(array, bins=25)
    plt.xlabel('x')
    plt.ylabel('frequency')
    plt.show()
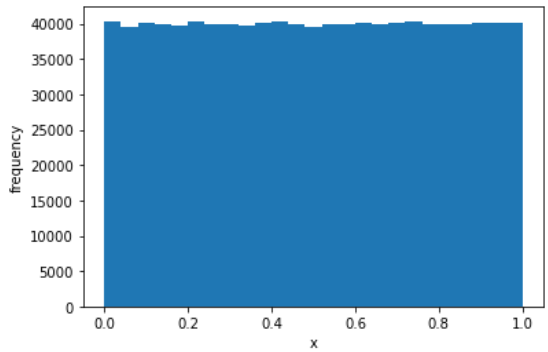
一様分布(0.0以上、1.0未満)の乱数を1,000,000個
x = random.rand(1000000)
hist(x)
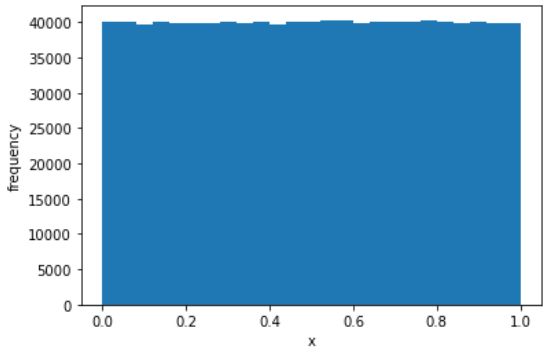
一様分布(0.0以上、1.0未満)の乱数を1,000,000個
x = random.random_sample(1000000)
hist(x)
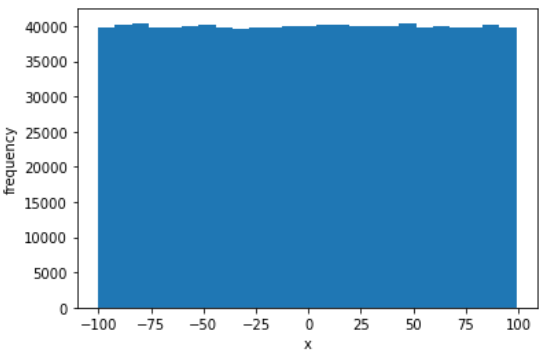
一様分布(任意の範囲の整数)の乱数を1,000,000個
x = random.randint(-100, 100, 1000000)
hist(x)
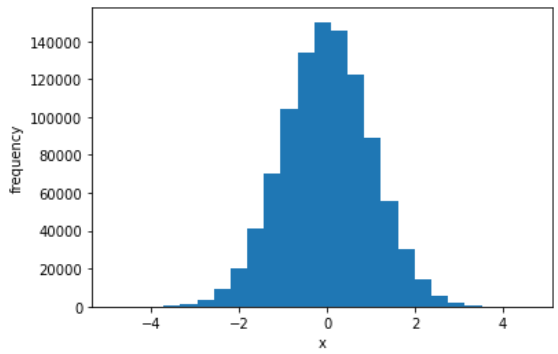
正規分布(平均=0, 分散=1)の乱数を1,000,000個
x = random.randn(1000000)
hist(x)
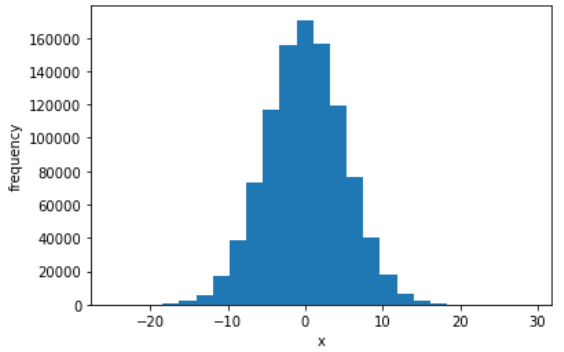
正規分布(任意の平均、標準偏差)の乱数を1,000,000個
x = random.normal(0, 5, 1000000)
hist(x)
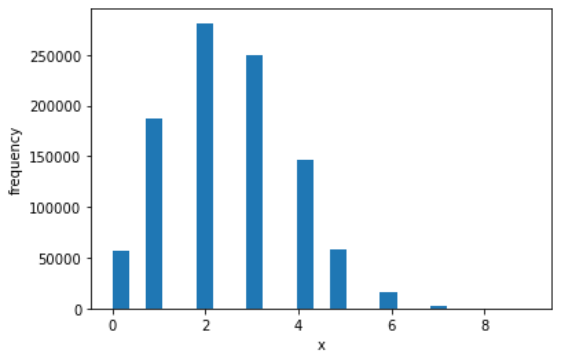
二項分布の乱数を1,000,000個
x = random.binomial(10, 0.25, 1000000)
hist(x)
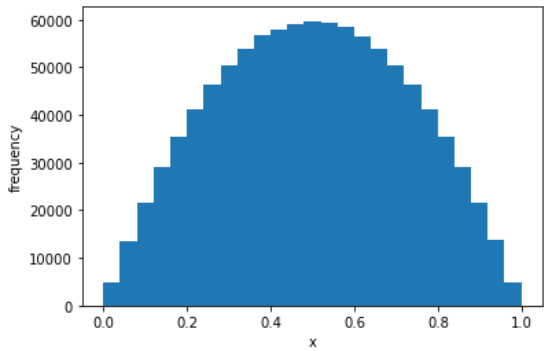
ベータ分布の乱数を1,000,000個
x = random.beta(2, 2, 1000000)
hist(x)
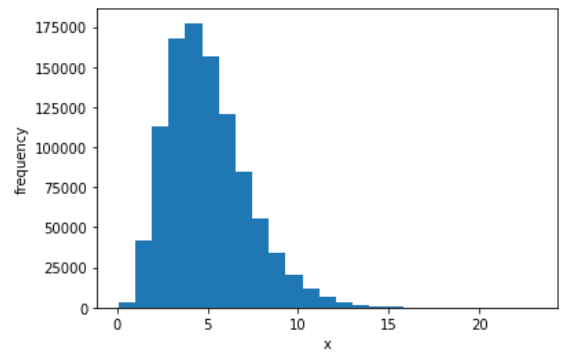
ガンマ分布の乱数を1,000,000個
x = random.gamma(5, 1, 1000000)
hist(x)
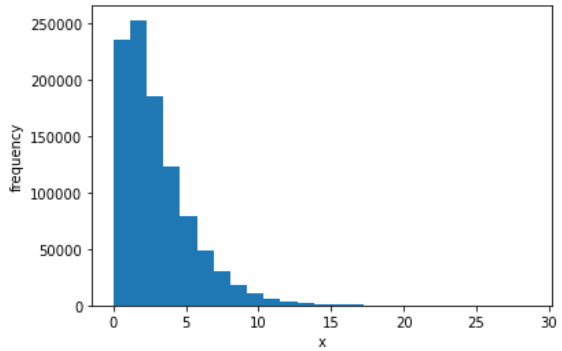
カイ二乗分布の乱数を1,000,000個
x = random.chisquare(3, 1000000)
hist(x)
