Dataikuでweb plugin作成してみます。とても簡単。
以下のサイトを参考にしましたが、散布図作るところが無いので、そこはDataikuにデフォルトで内蔵されているbokehのヒストグラムを使います。
参考URL:https://academy.dataiku.com/plugin-development/513345
前準備
まず、前準備として以下が必要です。
- Develop pluginsの権限があること。これないとできないのでとても注意です。無料版の場合は、全員Admin状態なので問題ないです。
- DSS settingsのAuthorization Matrixで確認できる
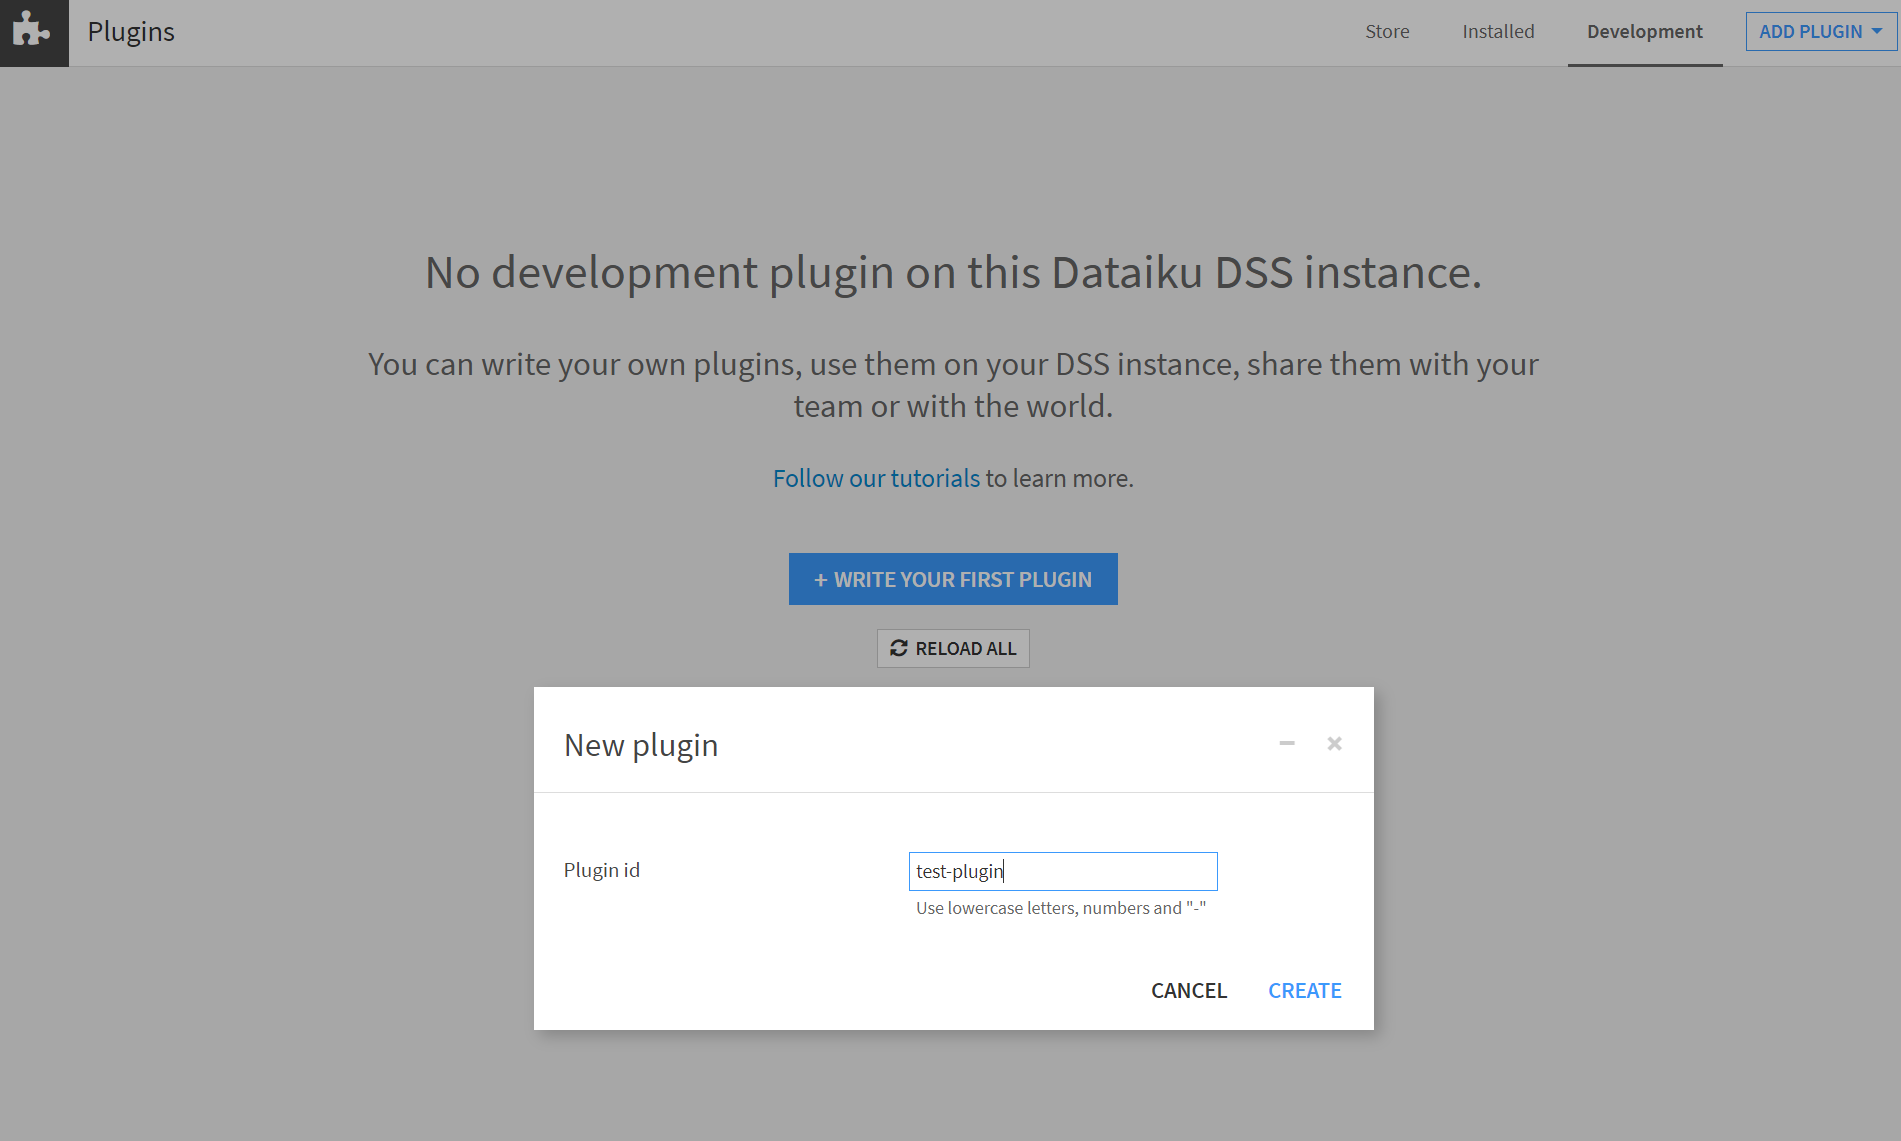
- Dev pluginを準備していること
- [Apps]->[Plugins]->[Development]->[+WRITE YOUR FIRST PLUGIN]をクリックしてPlugin idを設定。
Dataiku上で適当なWeb Appを準備
以下の要領で作ります。今回は、web appはなんでもよいので元から入っているサンプルを拝借します。
- plugin作成用のプロジェクトを作成
- [>]->[webapps]をクリック
- [+CREATE YOUR FIRST WEBAPP]をクリック
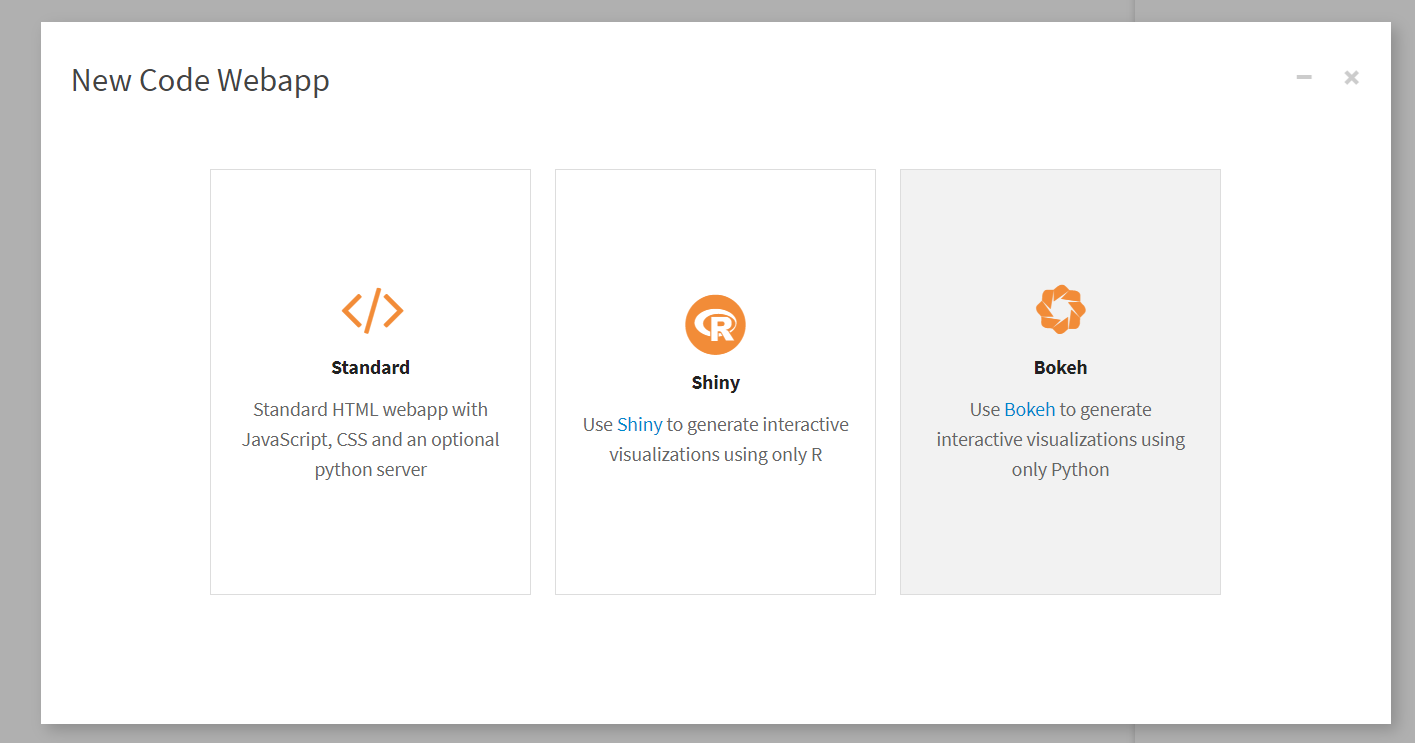
- [Code Webapp]をクリック
- とりあえずBokehでつくりますが、別になんでもいいです。Shinyもあるよ!
-
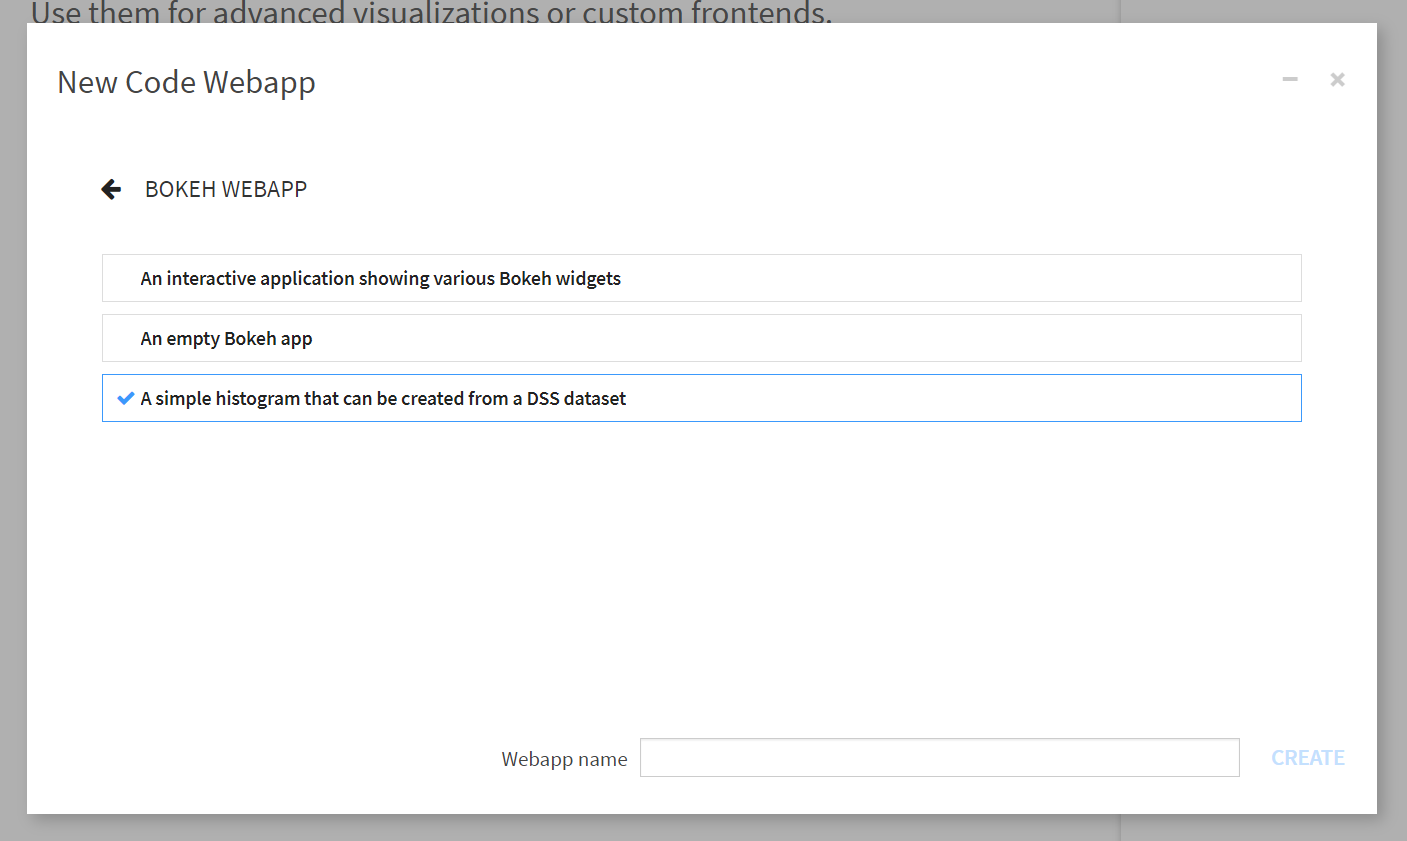
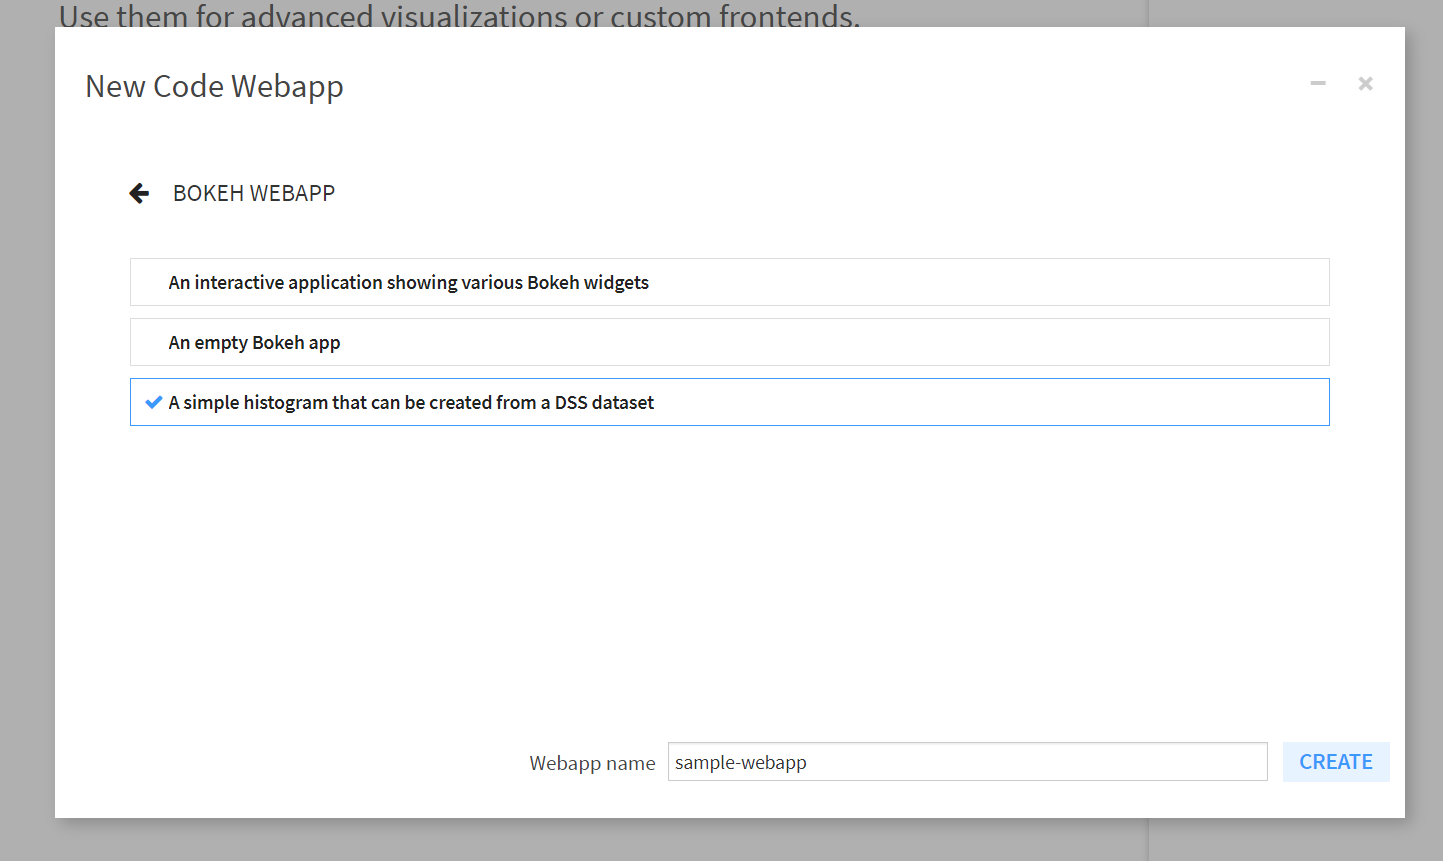
[A simple histogram that can e created from a DSS dataset]を選択
-
Webapp nameを入力して[CREATE]クリック
これで適当なBokeh web appが作成できました。
plugin化
- pluginアイコンをクリック
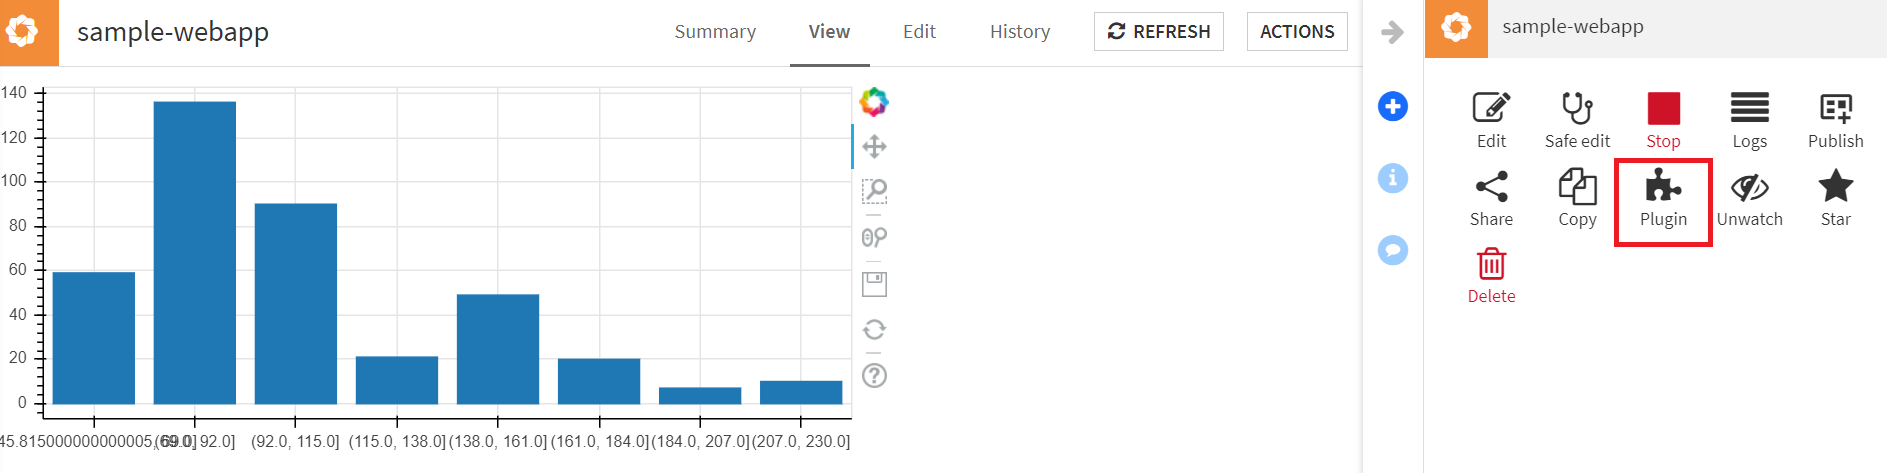
- Plugin idを選択し、New plugin webapp idを入力し、[CONVERT]をクリック。
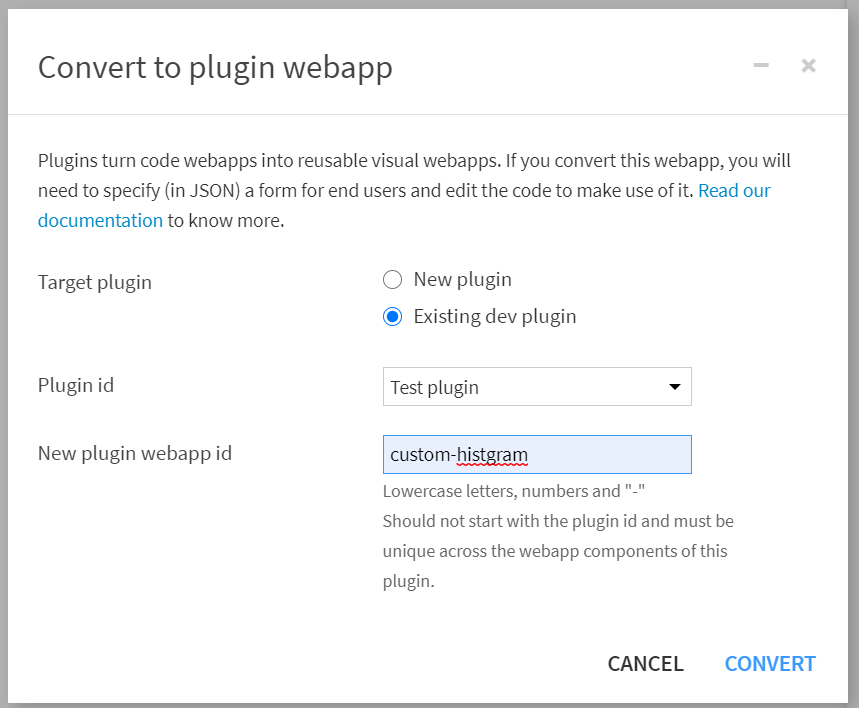
ちなみに、idに"_"は使えません。"-"とかにしないとCONVERTが押せないことに注意。
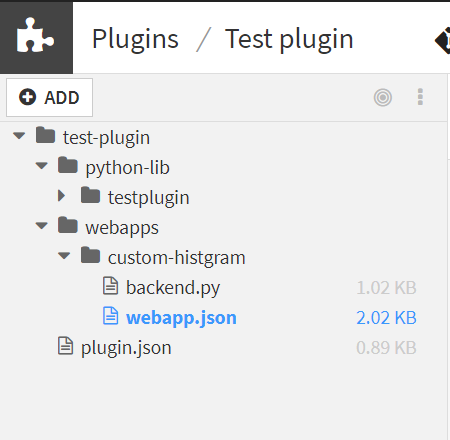
これで、pluginができています。ただし、入出力部分は修正が必要なので、webapp.jsonとbackend.pyを修正していきます。
[Apps]>[Plugins]>[Development]>[Test plugin]>[Custom histgram]
pluginの構造は以下のようになっています。
webapp.jsonがUI側の設定を記載したjsonファイルであり、backend.pyはbokehのプログラムとなります。
webapp.jsonのparamのところを以下のように差し替えます。ここはDataiku側のUIとのパラメータやりとりのとこなので、作ったアプリに合わせて適切に設定します。
    "params": [
        {
        "name": "input_dataset",
        "type": "DATASET",
        "label": "Dataset",
        "description": "The dataset used to populate the web app",
        "mandatory": true,
        "canSelectForeign": true
        },
        {
        "name": "input_column",
        "type": "DATASET_COLUMN",
        "datasetParamName": "input_dataset",
        "label": "Column",
        "description": "",
        "mandatory": true
        }
    ],
webapp.jsonの"roles"のところのコメントアウトもはずします。これをやらないとプロジェクト側で呼び出せません。
    "roles": [
         {"type": "DATASET", "targetParamsKey": "input_dataset"}
    ]
backend.py側も、パラメータ設定のところを変更します。
import dataiku
from bokeh.io import curdoc
from bokeh.plotting import figure
from dataiku.customwebapp import *

# Access the parameters that end-users filled in using webapp config
# For example, for a parameter called "input_dataset"
# ここで、入力パラメタを受け取る。ここの"input_dataset"などは、
# webapp.jsonの"params"記載事項に対応している。
input_dataset = get_webapp_config()["input_dataset"]
input_column = get_webapp_config()["input_column"]

# This loads sample dataset of cars data into a dataframe
# Let's disply a simple histogram of horsepower (the column is called hp)
# from bokeh.sampledata.autompg import autompg
# df = autompg
# column = 'hp'

# Uncomment the following to read your own dataset
# データセットをdataframeに変換。
dataset = dataiku.Dataset(input_dataset)
df = dataset.get_dataframe()
column = input_column

value_counts = df[column].value_counts(bins=8, sort=False)
values = value_counts.index.map(str).values

hist = figure(x_range=values, plot_height=250)
hist.vbar(x=values, top=value_counts, width=0.8)

# For more details about Bokeh's histograms and other charts,
# check Bokeh's documentation:
# https://bokeh.pydata.org

curdoc().add_root(hist)
[SAVEALL]>[ACTIONS]>[Reload thist plugin]をクリック。
任意のプロジェクトのフローに戻って、ブラウザのリロードをすると、Custom histgramというWebappsが表示されます。
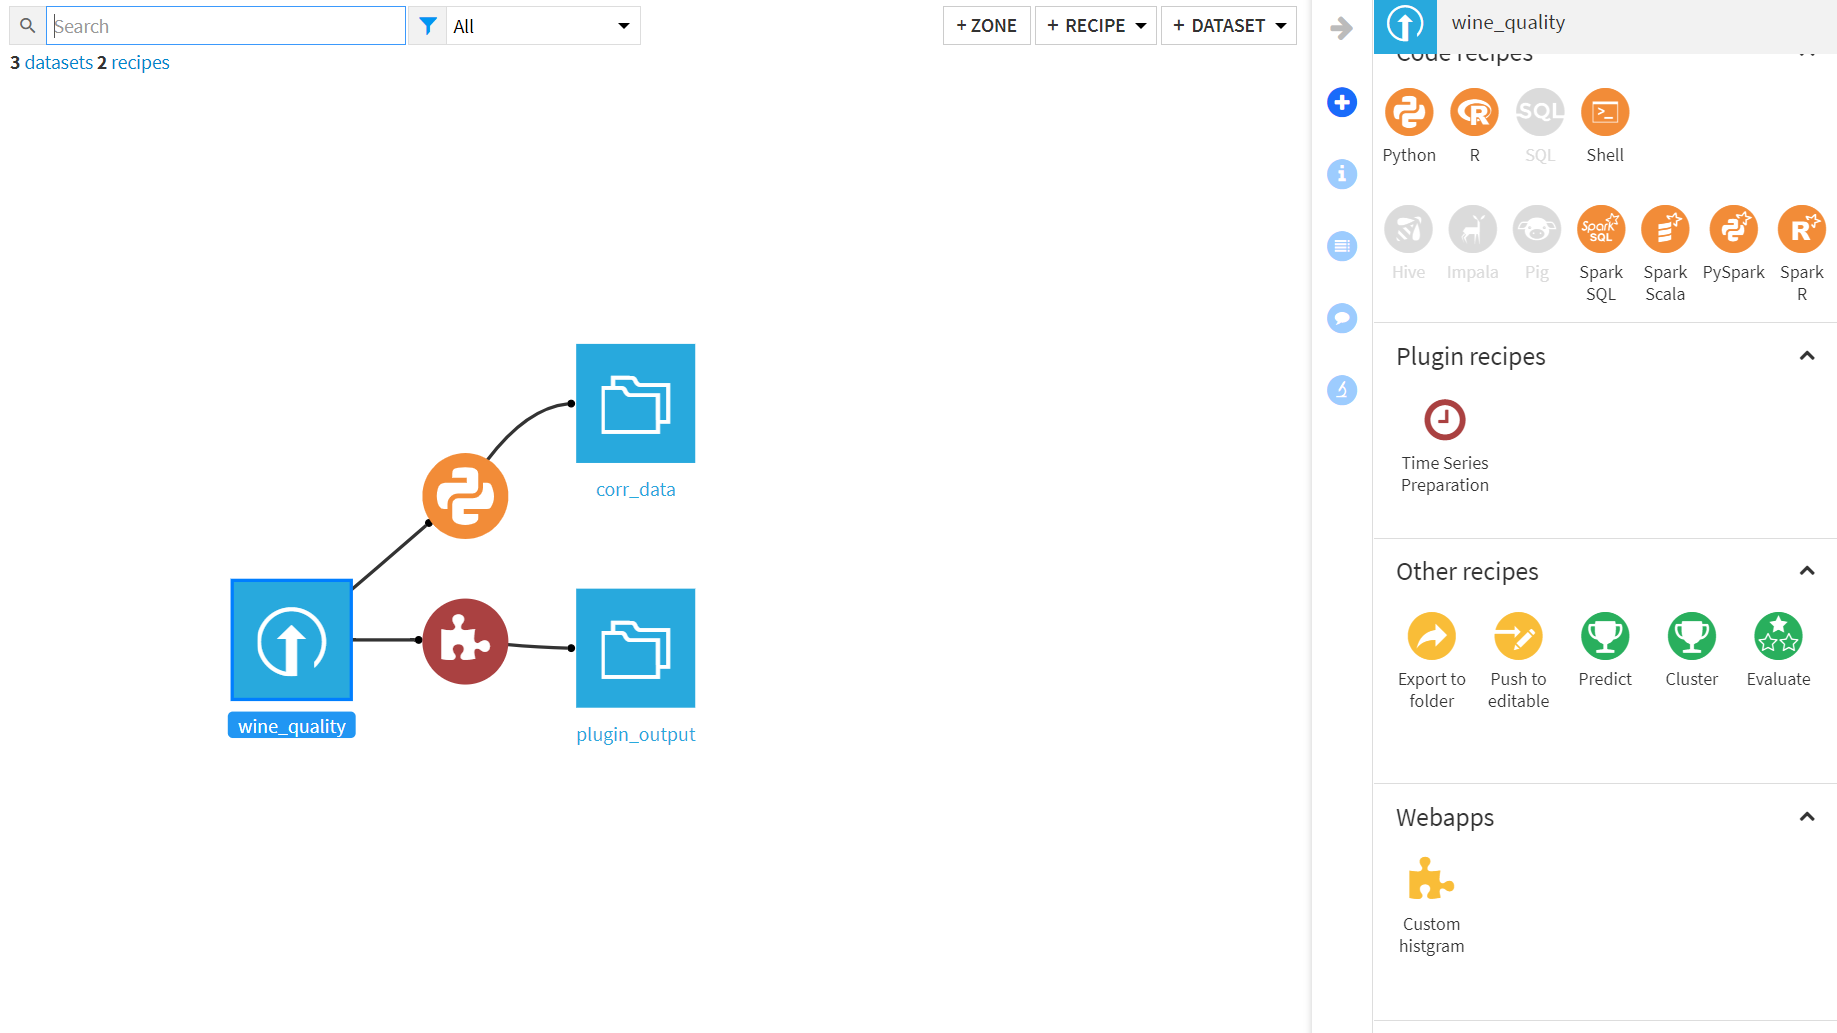
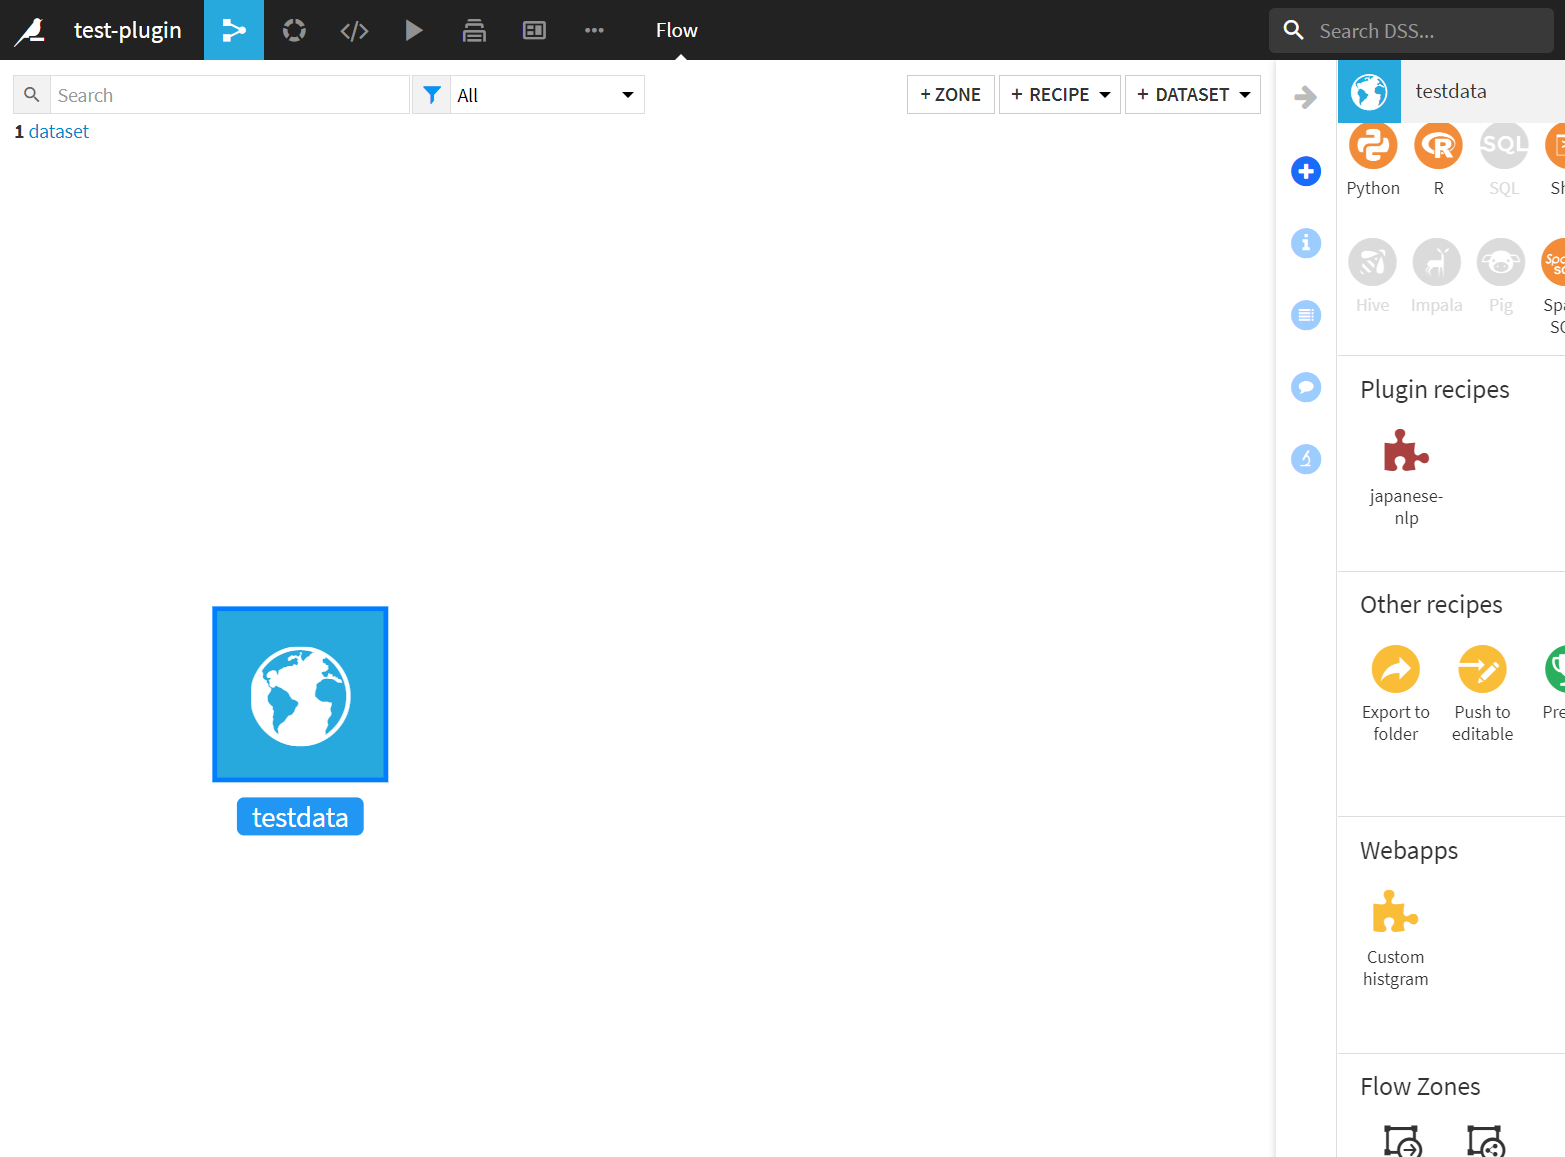
試しに使ってみたいと思います。ネット用のデモデータを、プロジェクトに取り込みます。
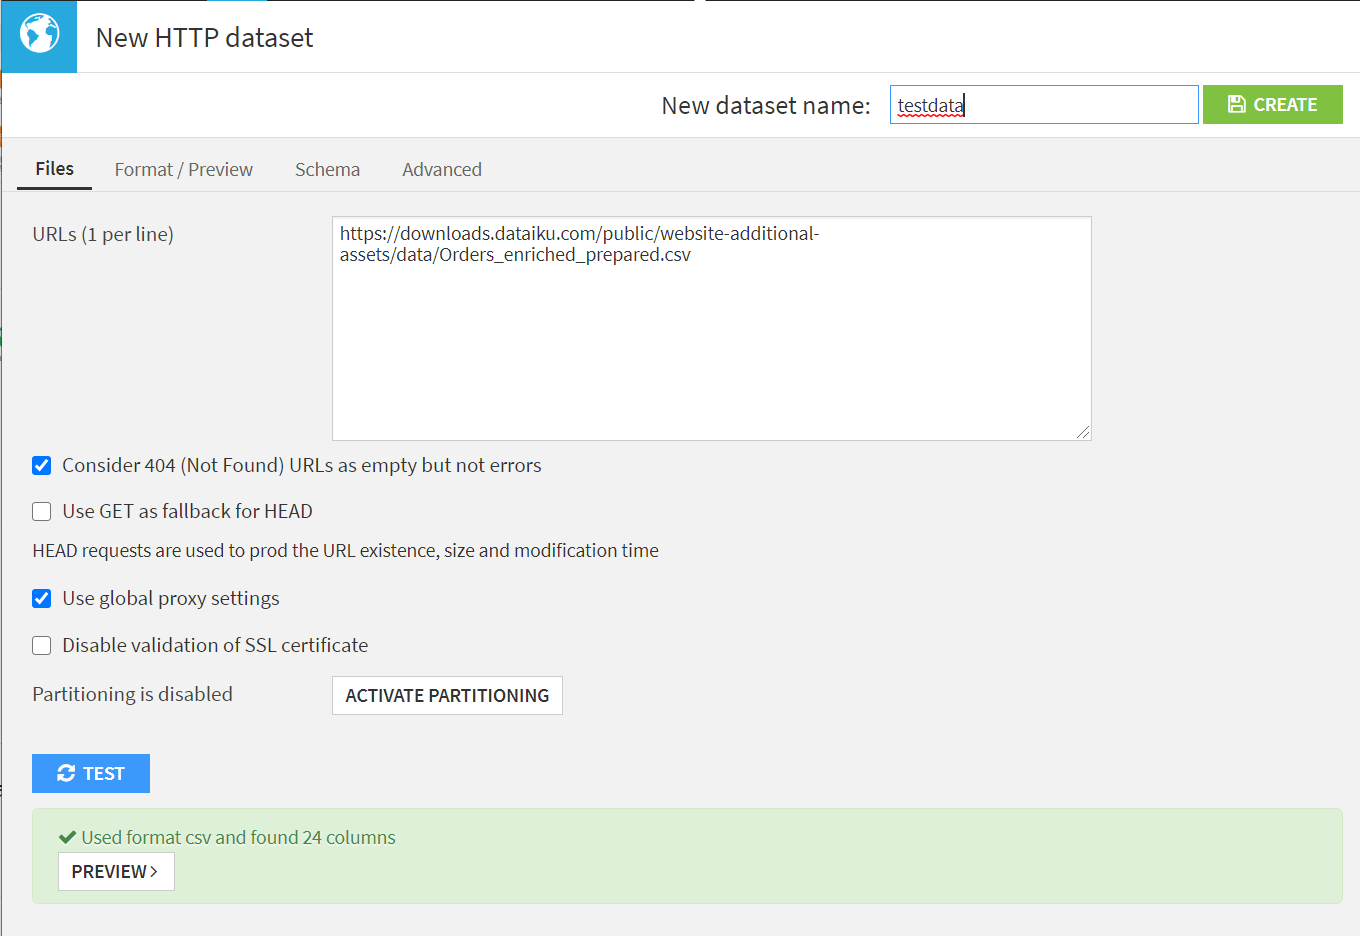
[+DATASET]>[NetWork]>[HTTP]
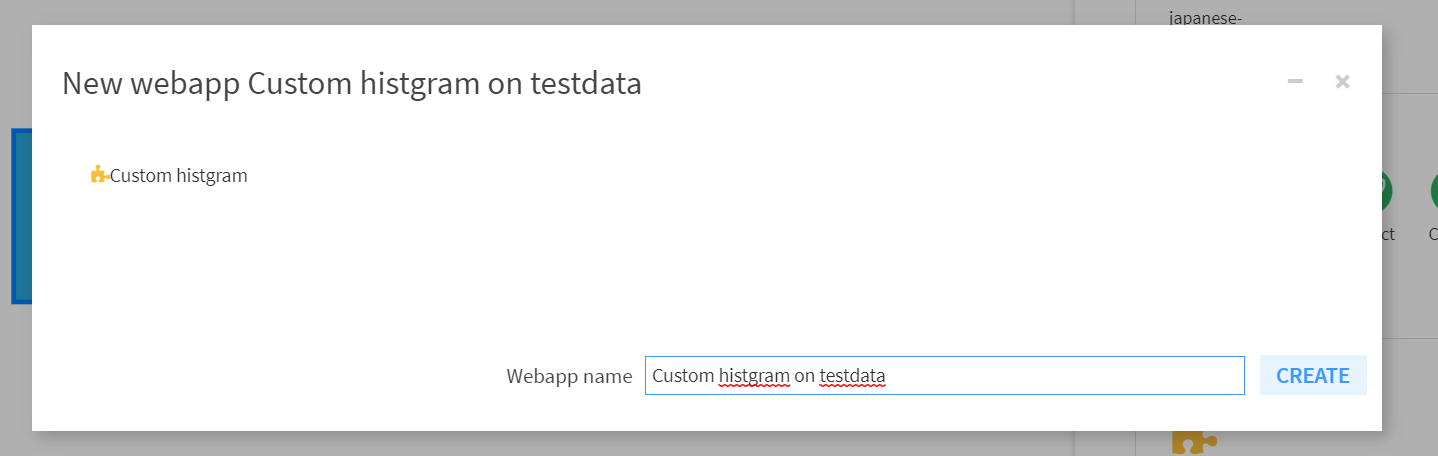
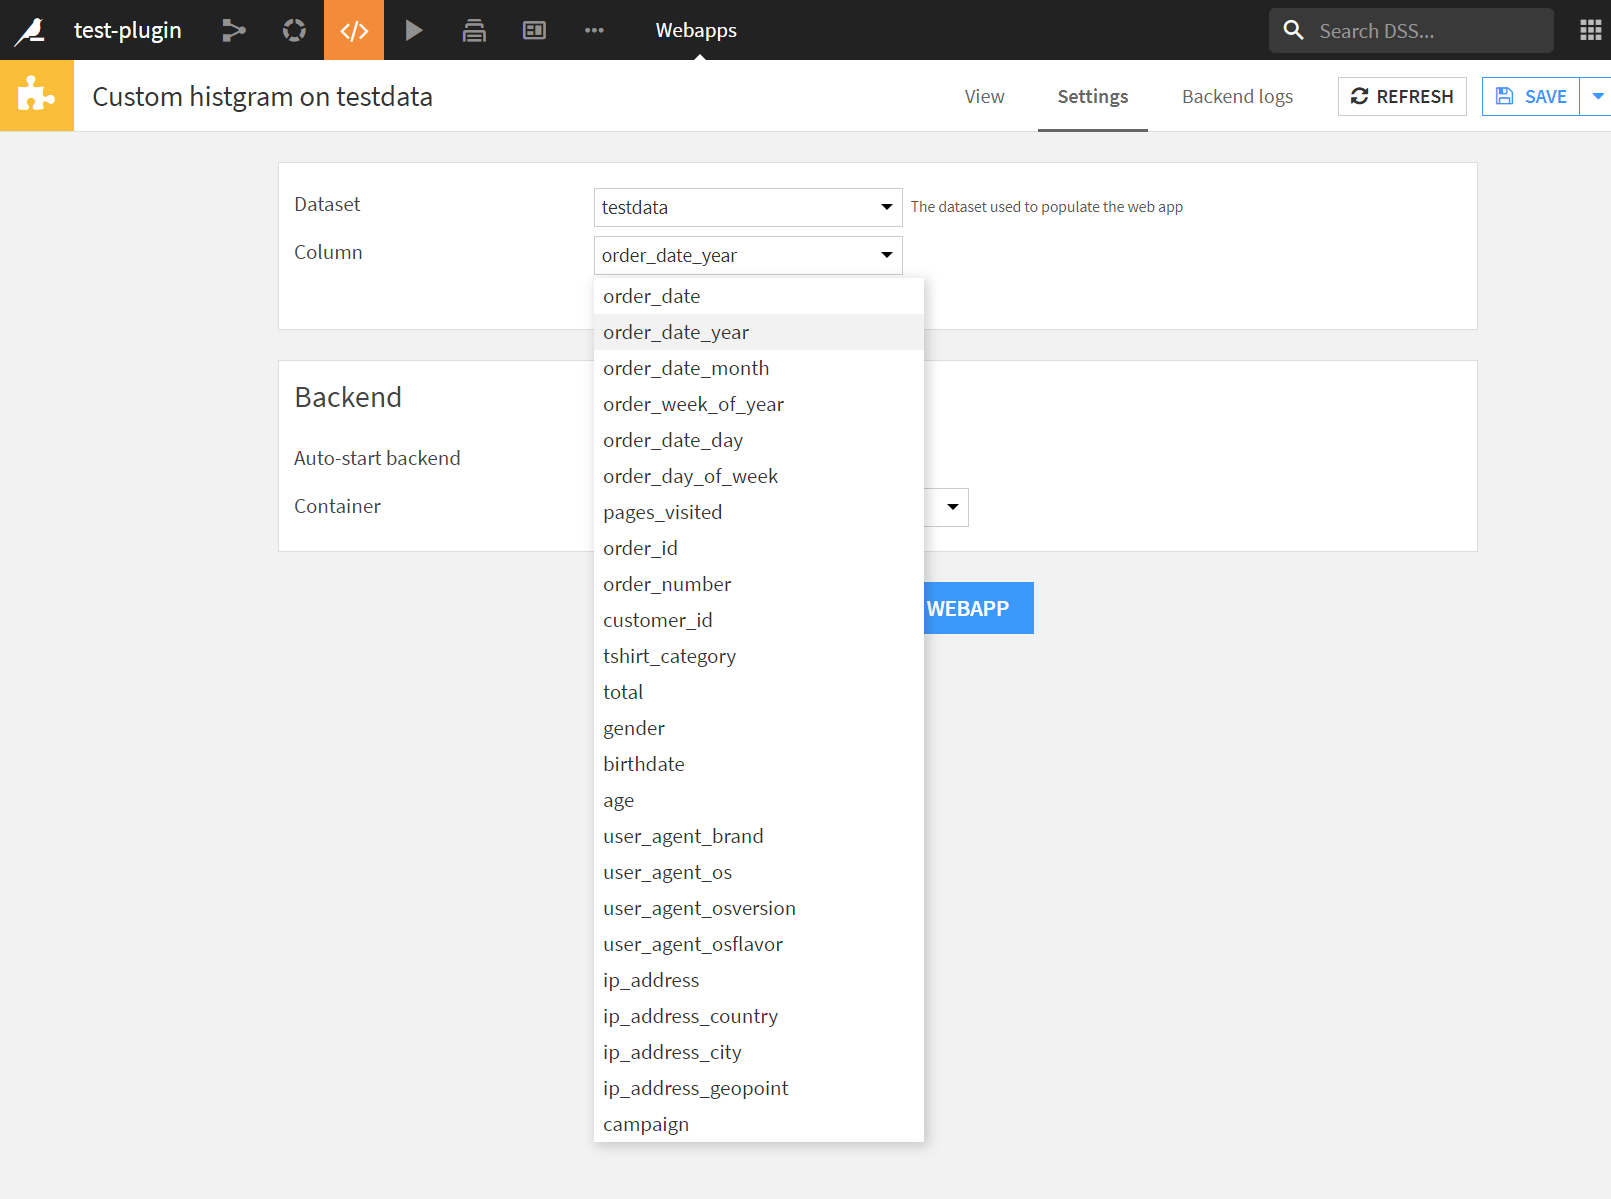
testdataデータセットを選択した状態で、Custom histgramアイコンをクリック
任意のwebapp nameを入力して[CREATE]
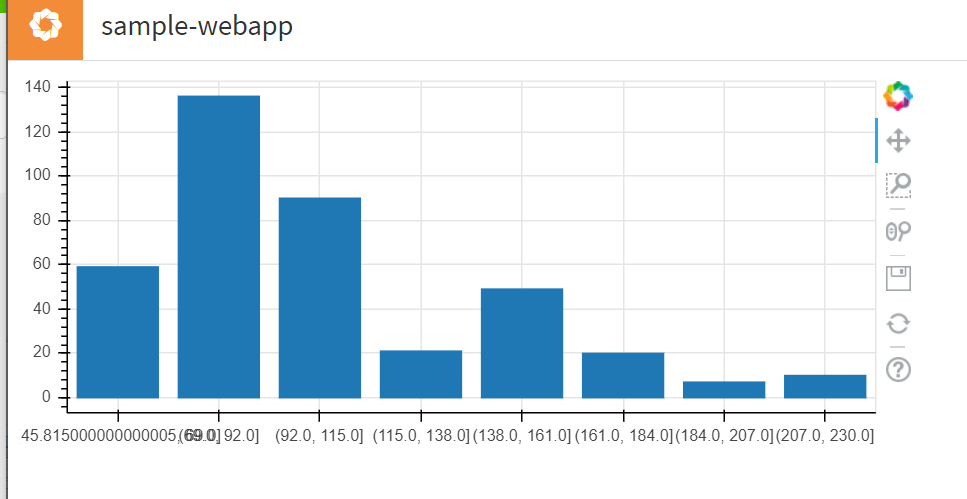
[Settings]でヒストグラム化する項目を選択して、[SAVE AND VIEW WEBAPP]をクリック。
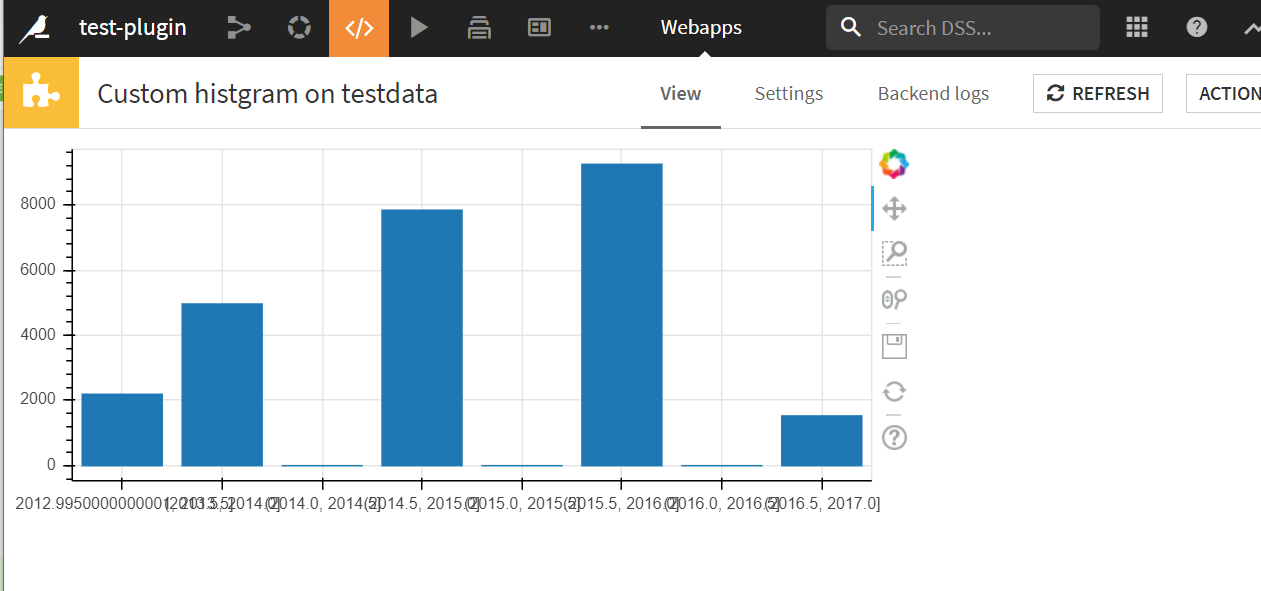
若干表示に時間かかりますが、ヒストグラムが生成されました。
基本的に、入力部分を書き換えればよいだけなので、webappのプラグイン化は非常に簡単です。自分が作ったwebappを他の方に共有するには便利だと思います。
ただ、プラグイン化したものを、ダッシュボードに載せたり、フローに反映させたりはできないようなので、プラグイン化する必要があるかどうかはよく考えたほうがよさそうです。