
| profiler | flat profile | call graph profile | interface | platform | profiling speed | to Flame Graph | to dot graph |
|---|---|---|---|---|---|---|---|
| gprof | ✅ | ✅ | CUI, GUI※1 | Windows, macOS, Linux | 0m2.891s※2 | ❌ | ✅ |
| perf | ✅ | ✅ | CUI, GUI※1 | Linux | 0m3.617s※2 | ✅ | ✅ |
| Valgrind | ✅ | ✅ | CUI, GUI※1 | macOS, Linux | 0m52.814s※2 | ❌ | ✅ |
| GDB | ❌ | ✅ | CUI, GUI※1 | Windows, macOS, Linux | 0m1.761s※2 | ✅ | ❌ |
| Instruments | ✅ | ✅ | CUI, GUI | macOS | 0m4.387s※3 | ❌ | ❌ |
※1 サードパーティ製のアプリケーションを採用することで実現が可能
※2 後述のプログラムの解析時間(timeコマンドのuser。CentOS)
※3 後述のプログラムの解析時間(timeコマンドのuser。macOS)
この他にもVisualStudio(VSPerf, VSDiagnostics)等色々なプロファイラがあるみたいなので、暇な時にでも追記していこうかなと思います。
性能解析対象
以下のプログラムを利用します。
#define MAX 10000

void initialize(int result[MAX]) {
    for (int i=0; i<MAX; i++) result[i] = 0;
}

void ten_thousand_loop(int result[MAX]) {
    for (int j=0; j<MAX; j++)
        for (int i=0; i<MAX; i++) result[i] = 0;
}

void twenty_thousand_loop(int result[MAX]) {
    for (int j=0; j<2*MAX; j++)
        for (int i=0; i<MAX; i++) result[i] = 0;
}

void thirty_thousand_loop(int result[MAX]) {
    for (int j=0; j<3*MAX; j++)
        for (int i=0; i<MAX; i++) result[i] = 0;
}

int main() {
    int result[MAX];

    initialize(result);
    ten_thousand_loop(result);
    twenty_thousand_loop(result);
    thirty_thousand_loop(result);

    return 0;
}
スペック
スペックは以下の通り。
Linux (CentOS8)
- CPU: Intel(R) Core(TM) m3-7Y32 CPU @ 1.10GHz
- memory: 4GB
今回は、ビルドにGCCを利用します。
OSはCentOS Linux release 8.1.1911 (Core)です。
# GCCのインストール
$ dnf install -y gcc

# ビルド (-g オプションでデバッグ情報を生成しておく)
$ gcc main.c -o sample_app -g

# 速度
$ time ./sample_app

real	0m2.325s
user	0m2.287s
sys	0m0.004s
macOS
- CPU: Intel(R) Core(TM) i7-1060NG7 CPU @ 1.20GHz
- memory: 16GB
今回は、ビルドにClangを利用します。
OSはmacOS Catalina version 10.15.7です。
# 事前にXcodeをAppstoreからダウンロードしてインストールしておく
# command line tools のインストール (Clangのインストール)
$ xcode-select --install

# ビルド (-g オプションでデバッグ情報を生成しておく)
$ clang main.c -o sample_app -g

# 速度
$ bash -c "time ./sample_app"

real	0m0.790s
user	0m0.754s
sys	0m0.004s
プロファイラ
gprof
gprof1はbinutilsに付属しているプロファイラです。
多分一番手軽です。
# gccを利用してビルドを行う(-pgオプションを忘れないこと)
$ gcc main.c -pg -o sample_app

# 実行とプロファイルデータの吐き出し
$ ./sample_app

# プロファイルデータの解析
$ gprof ./sample_app gmon.out
flat profile及びcall graph profileを吐き出してくれます。
Flat profile:

Each sample counts as 0.01 seconds.
  %   cumulative   self              self     total
 time   seconds   seconds    calls   s/call   s/call  name
 53.86      1.37     1.37        1     1.37     1.37  thirty_thousand_loop
 31.92      2.18     0.81        1     0.81     0.81  twenty_thousand_loop
 15.56      2.57     0.40        1     0.40     0.40  ten_thousand_loop
  0.00      2.57     0.00        1     0.00     0.00  initialize

:

		     Call graph (explanation follows)


granularity: each sample hit covers 2 byte(s) for 0.39% of 2.57 seconds

index % time    self  children    called     name
                                                 <spontaneous>
[1]    100.0    0.00    2.57                 main [1]
                1.37    0.00       1/1           thirty_thousand_loop [2]
                0.81    0.00       1/1           twenty_thousand_loop [3]
                0.40    0.00       1/1           ten_thousand_loop [4]
                0.00    0.00       1/1           initialize [5]
-----------------------------------------------
                1.37    0.00       1/1           main [1]
[2]     53.1    1.37    0.00       1         thirty_thousand_loop [2]
-----------------------------------------------
                0.81    0.00       1/1           main [1]
[3]     31.5    0.81    0.00       1         twenty_thousand_loop [3]
-----------------------------------------------
                0.40    0.00       1/1           main [1]
[4]     15.4    0.40    0.00       1         ten_thousand_loop [4]
-----------------------------------------------
                0.00    0.00       1/1           main [1]
[5]      0.0    0.00    0.00       1         initialize [5]
-----------------------------------------------

:

Index by function name

   [5] initialize              [2] thirty_thousand_loop
   [4] ten_thousand_loop       [3] twenty_thousand_loop
perf
perfはパフォーマンスカウンターを使用したLinux向けの性能解析ツールです2。
コマンドラインで操作することができます。
早速実行してみましょう。
# CentOS8の場合はパッケージマネージャを利用してインストールできる
$ dnf install -y perf
# カーネル解析の値を有効にしておく(/proc/sys/kernel/kptr_restrictの値を0にしておく)
$ echo 0 > /proc/sys/kernel/kptr_restrict
# 解析
$ perf record -- ./sample_app
# 結果確認
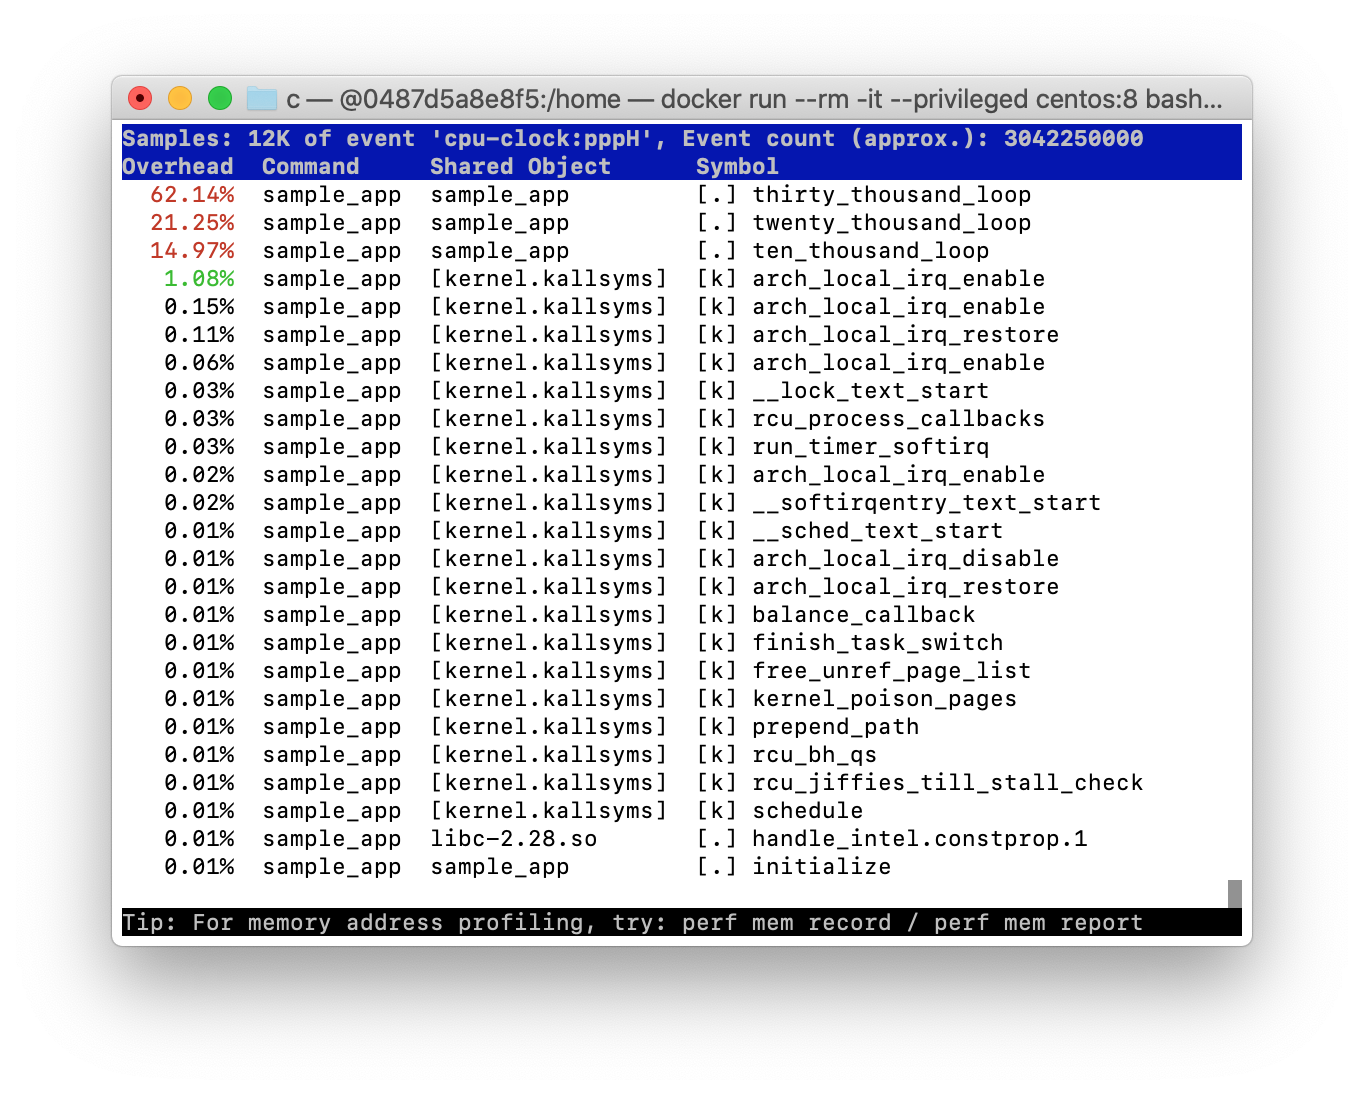
$ perf report
結果は降順で出力されます。
出力表示を終了したい場合はESCキーで抜けることができます。
また、以下のコマンドを利用することで元のファイルの行単位まで追うことができます。
# annotateの結果をless形式で表示する
$ perf annotate -l --stdio

Sorted summary for file /home/sample_app
----------------------------------------------

   99.95 main.c:19
: # annotateの結果が続く
更に、コールグラフを出力することも可能です。
FlameGraph3と組み合わせてSVG化し、可視化してみましょう。
# FlameGraphを取得するために必要なGitとSVG出力に必要なperl-openをインストール
$ dnf install -y git perl-open.noarch

# FlameGraphをインストール
$ cd /usr/local/
$ git clone https://github.com/brendangregg/FlameGraph.git
$ export PATH="${PATH}:/usr/local/FlameGraph/"
$ source ~/.bash_profile

# 一つ前のカレントディレクトリに戻る
$ cd -

# コールグラフの出力
$ perf record -F 99 --call-graph dwarf -g ./sample_app

# SVG化
$ perf script | stackcollapse-perf.pl | flamegraph.pl > flamegraph.svg
出力したflamegraph.svgをChromeなどのブラウザで表示してみましょう。

綺麗にSVG出力することができました。
横幅がCPU使用率を表しています。また、横軸はアルファベット順でソートされています。
赤やオレンジ等色の差に大きな意味はありません。グラフをみやすくするためのものです。
これさえあれば手軽にCPU使用率をわかりやすく共有することができますね。
以上をGUIで操作することができるhotspot4なる強力なツールが存在します。
今回の説明では省きますが、直感的に操作がしたい場合は選択肢に入れない手はないでしょう。
Valgrind
メモリエラーの検出に利用されるValgrindには、プログラムの実行における関数間の呼び出し履歴をコールグラフとして記録するCallgrindなるプロファイリングツールが付属しています。
# Valgrindのインストール
$ dnf install -y valgrind

# プロファイリング
$ valgrind --tool=callgrind --callgrind-out-file=./callgrind.out.sample_app ./sample_app
出力されたファイルは、KCachegrind等のGUIツールで可視化できる他、組み合わせによってはSVGのグラフに変換することも可能です。
早速SVG化してみましょう。今回はgprof2dotを利用します。
# gprof2dotの取得・実行に必要なPythonとSVG出力に必要なgraphvizをインストール
$ dnf install -y python36 graphviz

# gprof2dotをインストール
$ pip3 install gprof2dot

# SVGを出力
$ gprof2dot -f callgrind ./callgrind.out.sample_app | dot -Tsvg -o report.svg

綺麗にSVGを出力することができました。
GDB
こちらはプロファイラというよりはデバッグツールと呼んだ方が正しいような気がしますが、手軽なので紹介しておきます。
GDBではスタック上のバックトレースを表示することができます。
# GDBのインストール
$ dnf install -y gdb

# 実行
$ gdb ./sample_app --silent
Reading symbols from ./sample_app...done.

# 実行すると対話が始まる
# 対話ではbreakpointやbacktrace等の機能を利用することができる

# 試しに19行目にbreakpointを追加してみる
(gdb) break 19

# 実行
(gdb) run

# スタック全体のバックトレースを表示
(gdb) backtrace

#0  thirty_thousand_loop (result=0x7fffffff4f30) at main.c:19
#1  0x00000000004006ab in main () at main.c:28

# 終了
(gdb) quit
また、対話で渡すコマンドを事前に用意しておき、実行時にGDBに読み込ませてコマンドを流すことも可能です。
下記のようなファイルを用意し、--command= の後にファイル名を記述することで読み込むことができます。
# gdb ./sample_app --command=sample.gdb --silent
set confirm off
break 19
run
backtrace
quit
上記を利用して、GDBの出力結果をパイプでFlameGraph3のスクリプトに渡すことで、バックトレースをSVGで可視化することができます。
$ gdb ./sample_app --command=sample.gdb --silent | stackcollapse-gdb.pl | flamegraph.pl > flamegraph.svg

単純に関数の呼び順を確認したいのであればGDBで十分かもしれませんね。
Instruments
Instruments は Xcode の機能の一つ5です。
Instruments には Template と呼ばれる様々な機能が存在しますが、今回はその中の「Time Profiler」を利用してみましょう。
# Instruments (xctrace コマンドを利用できるようにする)
$ sudo xcode-select --switch /Applications/Xcode.app/

# プロファイリング
$ xcrun xctrace record --template 'Time Profiler' --output ./result.trace --launch -- ./sample_app

# 結果を開く
$ open ./result.trace
うまくいけば以下のようなアプリが起動するはずです。
コールグラフの ▶︎ マークをクリックしていくと、ネストされた結果を確認することができます。

参考
-
https://perf.wiki.kernel.org/index.php/Main_Page
> perf: Linux profiling with performance counters ↩