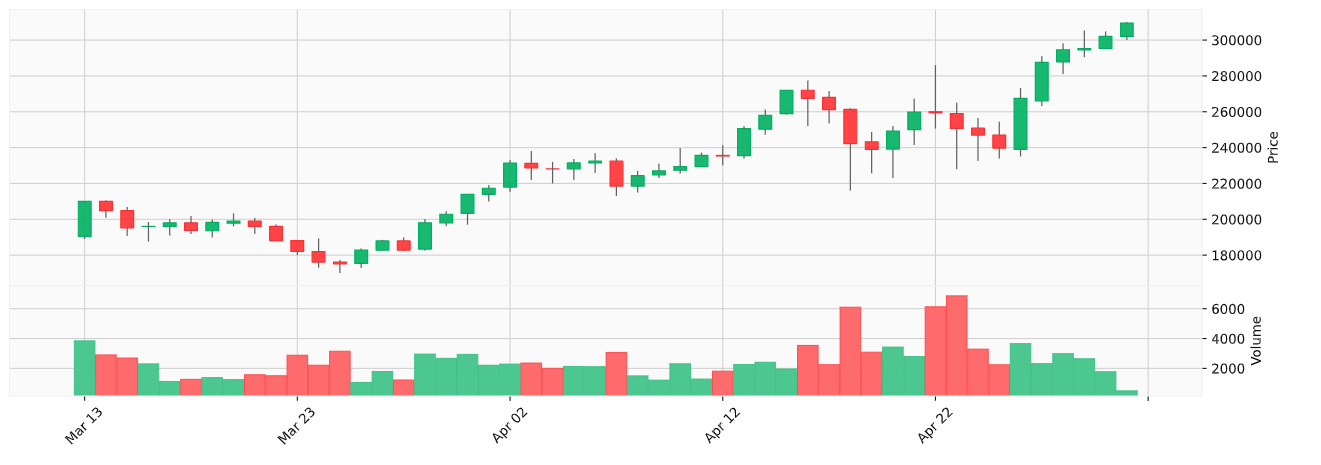
仮想通貨のAPIから日足データを取得してローソク足チャートを作ろうと調べてみたら、意外と簡単にできたので記事にしておきます。
大まかな手順は以下の通り
- APIからデータ取得
- データをpandasのDataFrameに変換、成形
- mplfinanceで描画
ローソク足チャートを作るには描画部分で色々と複雑なのですが、mplfinanceというパッケージを使ったら簡単でした。
- matplotlib/mplfinance: Financial Markets Data Visualization using Matplotlib
- pandas, Matplotlib(mplfinance)でローソク足チャートを作成 | note.nkmk.me
チャート画像を保存する方法もありますが、ここではJupiterを使う前提で行います。
完成したコードは以下の通りです。
# %%
import json
import urllib.parse
import urllib.request
import pandas as pd
import mplfinance as mpf

# 1. APIからデータ取得
def get_api(symbol: str, year: int) -> str:
    endPoint = "https://api.coin.z.com/public"
    klines = "/v1/klines"
    params = {"symbol": symbol, "interval": "1day", "date": year}
    url = endPoint + klines + "?" + urllib.parse.urlencode(params)
    req = urllib.request.Request(url)
    with urllib.request.urlopen(req) as response:
        return response.read()

# 2. データをpandasのDataFrameに変換、成形
def json_to_df(json_str: str) -> pd.DataFrame:
    d = json.loads(json_str)
    df = pd.json_normalize(d, record_path="data")
    df = df.astype("float64")
    df["openTime"] = pd.to_datetime(df["openTime"], unit="ms")
    df.set_index("openTime", inplace=True)
    df.columns = ["Open", "High", "Low", "Close", "Volume"]
    return df.tz_localize("UTC").tz_convert("Asia/Tokyo")

# 3. mplfinanceで描画
def plot(symbol: str, year: int, length: int) -> None:
    json_str = get_api(symbol, year)
    df = json_to_df(json_str)
    kwargs = dict(type="candle", volume=True, figratio=(12, 4))
    mpf.plot(df[-length:], **kwargs, style="yahoo")


plot("ETH", 2021, 50)
いくつかポイントがあるので解説します。
1. APIからデータ取得
def get_api(symbol: str, year: int) -> str:
    endPoint = "https://api.coin.z.com/public"
    klines = "/v1/klines"
    params = {"symbol": symbol, "interval": "1day", "date": year}
    url = endPoint + klines + "?" + urllib.parse.urlencode(params)
    req = urllib.request.Request(url)
    with urllib.request.urlopen(req) as response:
        return response.read()
GMOコインのAPIを使っています。
特に難しいことはしていません。取得したJSON文字列をそのまま返しています。
2. データをpandasのDataFrameに変換、成形
def json_to_df(json_str: str) -> pd.DataFrame:
    d = json.loads(json_str)
    df = pd.json_normalize(d, record_path="data")
    df = df.astype("float64")
    df["openTime"] = pd.to_datetime(df["openTime"], unit="ms")
    df.set_index("openTime", inplace=True)
    df.columns = ["Open", "High", "Low", "Close", "Volume"]
    return df.tz_localize("UTC").tz_convert("Asia/Tokyo")
まずjson.loadsで文字列をオブジェクト化します。
取得したJSONは以下のような形式です。
{
  "status": 0,
  "data": [
    {
      "openTime": "1609448400000",
      "open": "2976000",
      "high": "3035000",
      "low": "2960005",
      "close": "3016650",
      "volume": "420.6594"
    },
    {
      "openTime": "1609534800000",
      "open": "3012280",
      "high": "3437650",
      "low": "3000000",
      "close": "3300001",
      "volume": "838.9068"
    },# 以下略
  ]
}
dataの部分だけ欲しいので取り出します。
df = pd.json_normalize(d, record_path="data")
df = df.astype("float64")で型をfloat64にしています。bitcoinなんかはintで良さそうなのですが、銘柄によっては日本円換算で1円以下のものもあるのでfloatにしています。
次にAPIのopenTimeをTimestamp型にしてからindexにします。
pd.to_datetimeで型変換しますが、APIのopenTimeはUNIX時間のミリ秒なので引数にunit="ms"と加えます。
df.set_indexでインデックスにします。
df["openTime"] = pd.to_datetime(df["openTime"], unit="ms")
df.set_index("openTime", inplace=True)
mplfinanceでチャート化する時に読み込めるようにカラム名を変更、最後にタイムゾーンを設定してdataframeの成形は完了です。
df.columns = ["Open", "High", "Low", "Close", "Volume"]
return df.tz_localize("UTC").tz_convert("Asia/Tokyo")
                               Open      High       Low     Close    Volume
openTime
2021-01-01 06:00:00+09:00   76525.0   77695.0   73635.0   75270.0   2512.41
2021-01-02 06:00:00+09:00   75259.0   80970.0   74100.0   79199.0   3681.04
2021-01-03 06:00:00+09:00   78200.0  100000.0   77761.0   97404.0   7977.53
2021-01-04 06:00:00+09:00   97893.0  120419.0   90315.0  106086.0  18817.36
2021-01-05 06:00:00+09:00  105853.0  116900.0  100535.0  113100.0   7078.96
3. mplfinanceで描画
def plot(symbol: str, year: int, length: int) -> None:
    json_str = get_api(symbol, year)
    df = json_to_df(json_str)
    kwargs = dict(type="candle", volume=True, figratio=(12, 4))
    mpf.plot(df[-length:], **kwargs, style="yahoo")
先程の関数を使い、APIから取得してdataframeに変換します。
あとはmpf.plotするだけです。style="yahoo"としていますが、ここで色々なデザインを設定できます。
実行
plot("ETH", 2021, 50)
この例ではイーサリアムの2021年データを取得して50日分表示しています。
事前にpip install mplfinanceするのを忘れるとエラーが出るので注意。
