0
0

Delete article

Deleted articles cannot be recovered.

Draft of this article would be also deleted.

Are you sure you want to delete this article?

More than 5 years have passed since last update.

GCPのログデータで1日の傾向を見てみる

Posted at

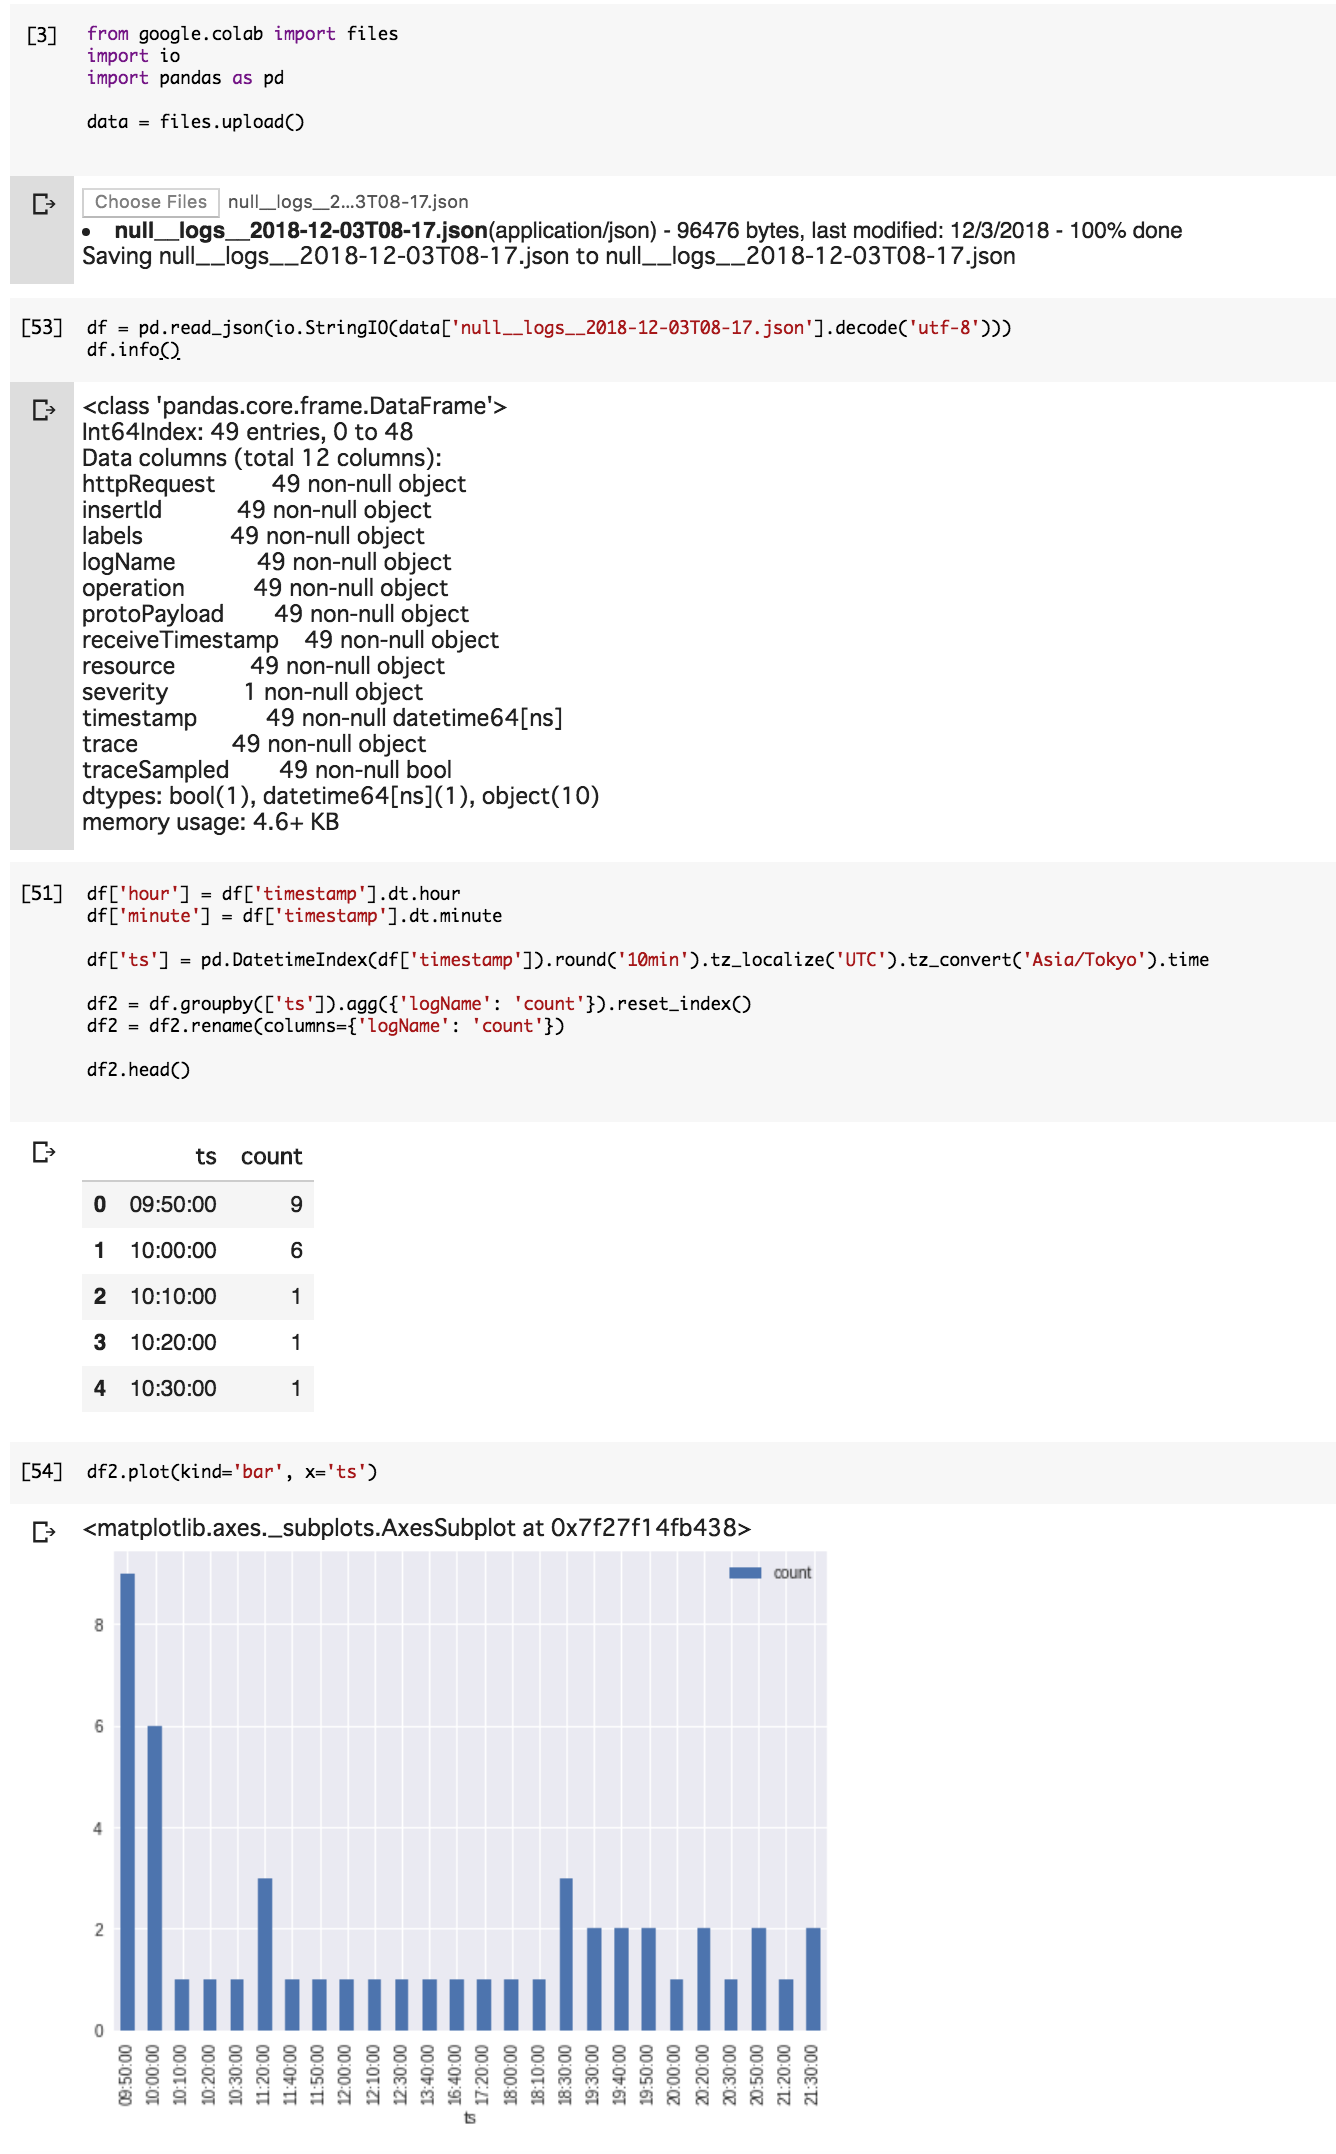
GCPのログデータをエクスポートし、数日のデータから、1日の傾向を集計するためのメモ

実行にはColaboratoryを利用しました https://colab.research.google.com

データを読み込む

df = pd.read_json(io.StringIO(data['null__logs__2018-12-03T08-17.json'].decode('utf-8')))

10分でまとめる

df['ts'] = pd.DatetimeIndex(df['timestamp']).round('10min').tz_localize('UTC').tz_convert('Asia/Tokyo').time

df2 = df.groupby(['ts']).agg({'logName': 'count'}).reset_index()
df2 = df2.rename(columns={'logName': 'count'})

プロットする

df2.plot(kind='bar', x='ts')

image.png

10時付近に何かが多いことがわかる

0
0
0

Register as a new user and use Qiita more conveniently

  1. You get articles that match your needs
  2. You can efficiently read back useful information
  3. You can use dark theme
What you can do with signing up
0
0

Delete article

Deleted articles cannot be recovered.

Draft of this article would be also deleted.

Are you sure you want to delete this article?