はじめに
初めまして!ナイトレイでデータエンジニアをしているバングラデシュ出身のアティカです。
私は SQL を活用したデータ処理やQGIS ツールを用いた地理情報の可視化し、インサイトの提供を行っています。
私は GISデータを学び始めたばかりのデータエンジニア で、現在 QGIS の使い方を勉強している最中 です。今回のプロジェクトでは、GISデータの取り扱いに関する新しい課題に直面し、試行錯誤しながら解決方法を見つけました。本記事では、その学びを共有したいと思います。
さて、早速話題に入りましょう!今回の内容は英語(+ Chat GPTによる日本語翻訳)ですが、どうぞよろしくお願い致します。
Overview
When working with geographic data in GIS software (like QGIS), it's important that different datasets line up correctly. Recently, I was working on a project involving vehicle GPS data to analyze how well the GPS data matched with existing road maps.
At first, I used the "Join Attributes by Location" tool with the Intersect option. However, I noticed that some roads which seemed visually aligned were not being matched correctly. After looking deeper, I realized this happened because the two datasets (reference roads and target roads) were not exactly aligned or "matched" at a geometric level, even though they appeared correct visually.
This mismatch can happen due to differences in data collection methods, slight shifts in coordinates, or minor digitization errors.
To solve this issue, I explored other methods in QGIS and found a straightforward solution. In this article, I will explain the problem, the steps I took to solve it, and the final solution clearly. If you're facing similar problems, this guide might help you too.
GISソフト(QGISなど)で複数のデータを扱うとき、データ同士の位置が正確に一致していることが大切です。最近、私は車両のGPSデータと既存の道路ラインデータを比較して、正しく重なっているかを調査しました。
最初はQGISの「位置で属性を結合(Join Attributes by Location)」というツールを使い、道路ライン同士が交差(Intersect)しているかを調べました。しかし、画面上ではぴったり重なっているように見える道路が、なぜかうまく一致していないという問題が起こりました。
詳しく調べたところ、原因は2つのラインデータ(基準となるラインデータと対象のラインデータ)が完全には重なっていなかったからでした。視覚的には重なっていても、データの精度や収集方法の違いによって、小さなズレが発生してしまったのです。
この問題を解決するためにQGISで様々な方法を試し、簡単で効果的な方法を見つけました。この記事では、この問題の説明、私が行った解決方法とその手順をわかりやすく紹介します。同じ問題に悩んでいる方に参考になれば嬉しいです。
What Was the Problem?
The issue was that the two road datasets—reference roads and target roads—looked aligned visually but were slightly shifted at a data level. For example, the reference roads might show roads in a certain location, while the target roads were slightly offset, even though on the screen they seemed aligned.
Due to these small differences, QGIS didn't recognize them as intersecting. This prevented accurate spatial analysis.
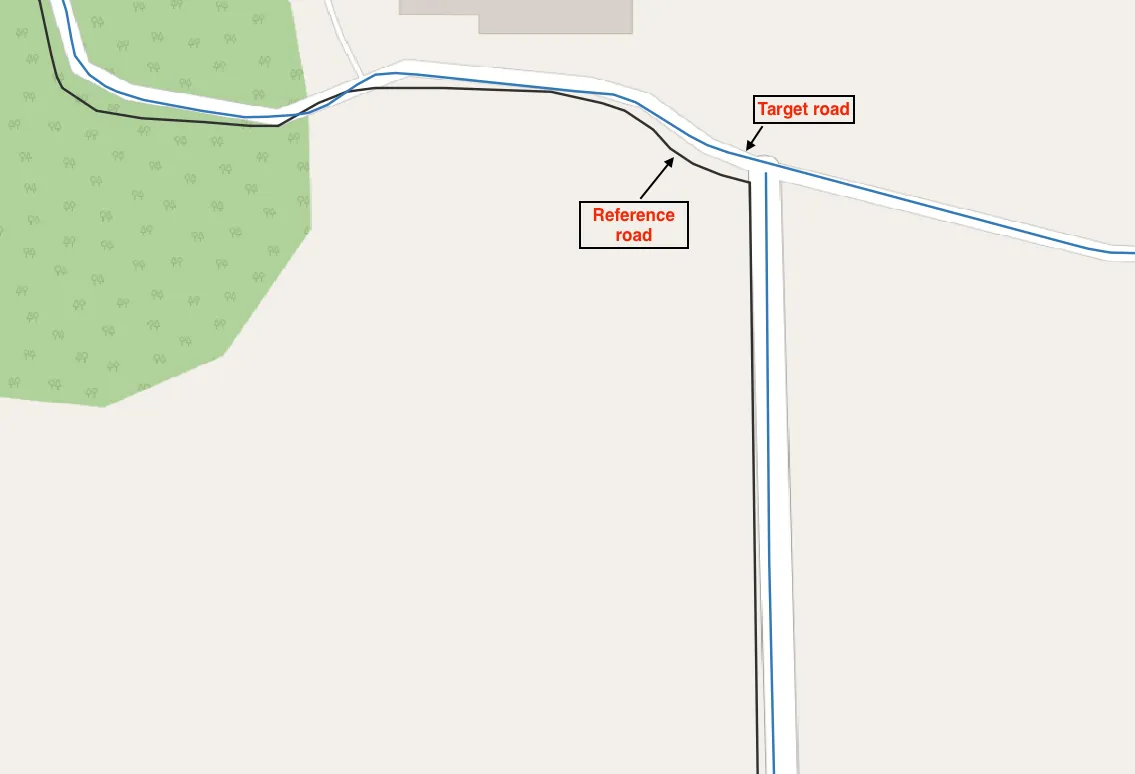
To help visualize this, please see the image below. It shows how roads appear to align visually but actually don't overlap perfectly.
今回の問題は、2つの道路ラインデータが画面上ではきれいに重なっているように見えるのに、実際のデータ上は少しズレていたことです。例えば、基準となる道路ラインデータ(黒)と対象の道路ラインデータ(青)が視覚的には合っていますが、実際には数メートルほどズレており、QGISが交差していると判断してくれませんでした。
このズレが原因で、GISを使った正確な分析が難しくなっていました。
以下の画像で、視覚的には合っているのにデータとしてはズレている例を示しています。
Final Result
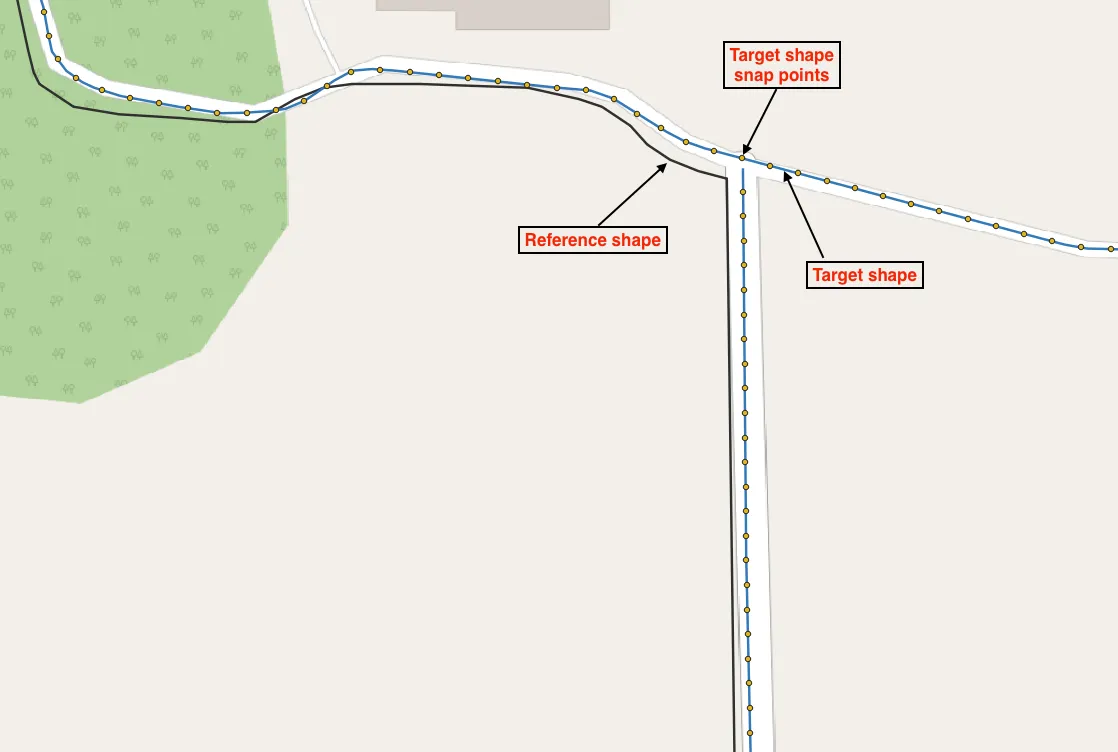
By following the solution outlined in this article, the final result is a clean and aligned dataset that accurately represents the actual road network. See the final result image below.
この記事で紹介する方法で修正した結果、道路データがきれいに重なり、正確な位置情報が得られました。結果の画像を以下に示します。

Procedure:
To fix this problem, I followed these four clear steps in QGIS:
QGISで以下の4つの手順を使って問題を解決しました。
Step 1: Create Points on the Target Roads
First, I created evenly spaced points along the target roads using QGIS's "Points Along Geometry" tool. This tool places points along roads at regular intervals. I chose an interval based on how detailed I wanted the analysis to be. This step makes it easier to match points to the correct roads later on.
See the image below for the settings used in this step:
まずは、対象の道路ラインデータに沿って一定間隔でポイントを作成しました。「Points Along Geometry」というQGISのツールを使い、好きな間隔でポイントを配置しました。これにより、後でライン同士を合わせる作業がやりやすくなります。
詳しい設定は下の画像を確認してください。


Step 2: Snap the Points to the Reference Roads
Next, to fix minor misalignments, I used the "Snap Geometries to Layer" tool. This tool moves points from the target roads to exactly match the nearest location on the reference roads. I set a tolerance of 10 meters, meaning points within 10 meters of the reference roads were adjusted.
This step ensures the points are precisely aligned to the reference dataset. Check the image below for the exact settings:
次に、小さな位置ズレを修正するために、対象の道路ポイントを基準の道路ラインに「スナップ」させました。スナップとは、近くにあるポイントを自動的に一番近い道路ラインにピタッと移動させる作業です。今回は10m以内のズレならスナップされるよう設定しました。
この作業によりポイントが正しく基準の道路ラインに一致します。詳しい設定は以下の画像を参考にしてください。


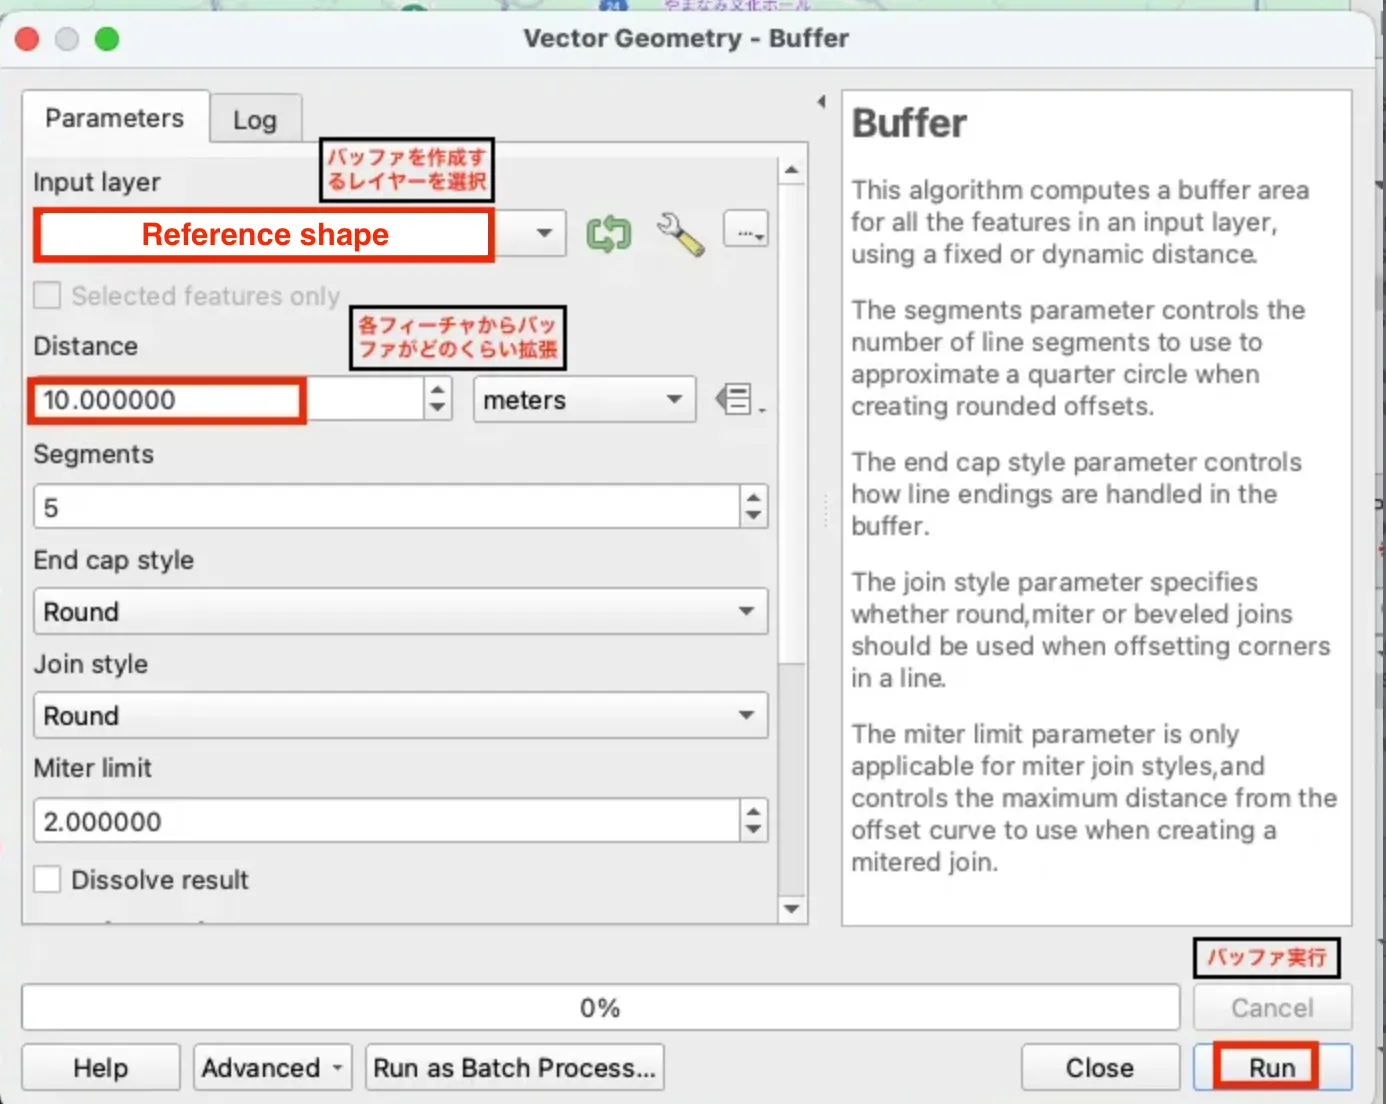
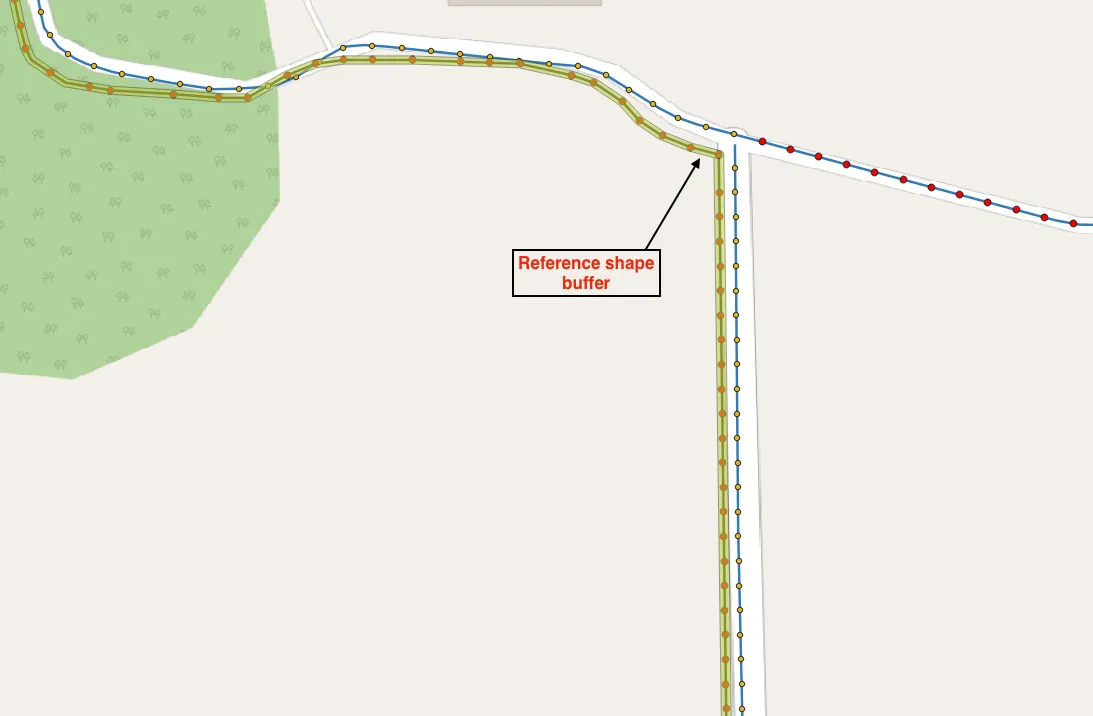
Step 3: Buffer the Reference Roads
After snapping the points, some small gaps or overlaps might still exist between the roads and points. To solve this, I applied a buffer around the reference roads. A buffer creates a wider boundary around the road lines to close small gaps or overlaps. I used a 10-meter buffer and chose the "Dissolve" option to merge overlapping areas into a single clean geometry.
This step improved overall dataset coverage and alignment. See the image below for how this was configured:
スナップ後も小さなズレや隙間が残る場合があるので、基準の道路ラインにバッファ(一定距離の範囲)を作りました。バッファを設定するとラインの周りに少し幅ができ、小さなズレや隙間を埋めることができます。今回は10mのバッファを使い、「Dissolve(重なりをまとめる)」オプションで重なった部分を一つにまとめました。
設定は下の画像をご覧ください。

Step 4: Merge (Join) Attributes
Finally, I used the "Join Attributes by Location" tool to combine the snapped points and the buffered roads. I chose the "Intersects" method, which transferred attributes from the buffered roads to the snapped points if they overlapped. This step created a final dataset where points now accurately represented attributes from the road dataset.
Check the image below for settings used in this step:
最後に「位置で属性を結合(Join Attributes by Location)」ツールを使い、スナップしたポイントとバッファした道路ラインを統合しました。「交差(Intersects)」という方法を使い、バッファの範囲内にあるポイントに属性を付与しました。これにより、ポイントは正しい道路ラインの情報を持つようになりました。
詳しい設定は以下の画像をご覧ください。


Conclusion with Summary Diagram:
Through this process, I successfully resolved the topological mismatches and ensured that the vehicle GPS data accurately reflected the road network coverage. The final dataset was now aligned, making further analysis, such as coverage mapping and spatial queries, more reliable and precise.
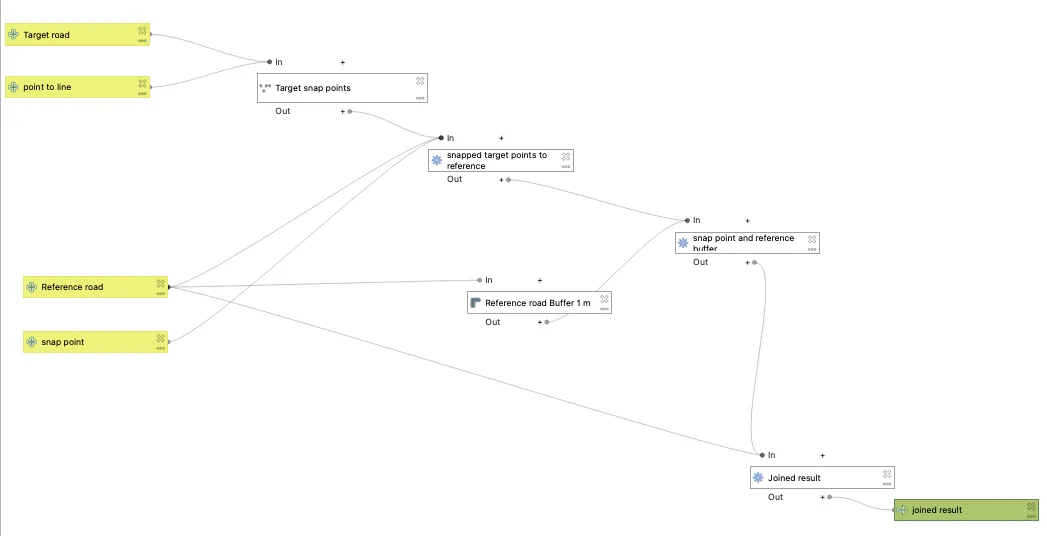
To summarize, the workflow involved the following key steps:
これらの手順を実施することで、ラインデータの位置ズレ問題が解決しました。最終的なデータは道路情報を正確に反映しており、今後のGIS分析(カバレッジの計算や空間解析)がより正確にできるようになりました。
今回の流れをもう一度簡単にまとめます:
- Generating Points Along the Target Roads(対象ラインデータにポイントを作成) – Creating evenly spaced points along road geometries to facilitate alignment.
- Snapping Points to Reference Roads(基準ラインデータにポイントをスナップ) – Adjusting points to ensure they align with the reference dataset using a snapping tolerance.
- Buffering Reference Roads(基準ラインにバッファを作成) – Expanding road coverage by creating a buffer to fix gaps and minor misalignments.
- Merging Attributes(データを統合(位置属性の結合) – Using spatial joins to transfer attributes from the buffered reference roads to the aligned points.
Below is a simplified workflow diagram summarizing these steps:
以下に作業の流れを簡単に表した図を用意しました。