はじめに
matplotlibのプロット上でマウスによるボックス領域選択を行い、その結果(座標)を求めるコードを書きました。これの実現のためにはmatplotlib.widgetsというモジュールを使用します。もちろんmatplotlib.orgに載っているサンプルコードでも良いのですが、こちらはそのままでは座標を格納できないので以下のクラスのように実装する必要があると思います。また、領域の確定後に色付きボックスが残るようにアレンジしてみました(サンプルコードでは確定後にボックスが消えてしまいます)。
rectselect.py
以下のrectselect.pyをモジュールとしてインポートして使用します。色付きボックスのアレンジに関わるのがrelease関数なので、確定後にボックスを消したい場合にはreleaseに関わる行をコメントアウトすればOKです。
rectselect.py
import numpy as np
import matplotlib.pyplot as plt
from matplotlib.patches import Rectangle
from matplotlib.widgets import RectangleSelector

class RectSelect(object):
    def __init__(self, ax=None):
        self.ax = ax or plt.gca()
        self.rect = Rectangle((0,0), 0, 0, color='orange', alpha=0.5)
        self.ax.add_patch(self.rect)
        self.blc = np.zeros(2)
        self.trc = np.zeros(2)

        def selector(event):
            if event.key in ['Q', 'q'] and selector.RS.active:
                print ('RectSelect deactivated.')
                selector.RS.set_active(False)
            if event.key in ['A', 'a'] and not selector.RS.active:
                print ('RectSelect activated.')
                selector.RS.set_active(True)

        selector.RS = RectangleSelector(self.ax, self.callback)
        self.ax.figure.canvas.mpl_connect('key_press_event', selector)
        self.ax.figure.canvas.mpl_connect('button_release_event', self.release)

    def callback(self, eclick, erelease):
        x0, x1 = eclick.xdata, erelease.xdata
        y0, y1 = eclick.ydata, erelease.ydata
        self.blc = min(x0, x1), min(y0, y1)
        self.trc = max(x0, x1), max(y0, y1)
        blc_print = '({:0.4},{:0.4})'.format(*self.blc)
        trc_print = '({:0.4},{:0.4})'.format(*self.trc)
        print('blc={}, trc={}'.format(blc_print, trc_print))

    def release(self, event):
        self.rect.set_width(self.trc[0] - self.blc[0])
        self.rect.set_height(self.trc[1] - self.blc[1])
        self.rect.set_xy(self.blc)
        self.ax.figure.canvas.draw()
サンプルコード
実際の使用の際にはplt.show()の直前にRectSelectインスタンスを置けば動作します。対象とするaxesを明示的に指定することもできます。以下、実際の動作の様子です。
import numpy as np
import matplotlib.pyplot as plt
from rectselect import RectSelect
# 何かプロット
x = np.random.random(20) * 10
y = np.random.random(20) * 10
plt.plot(x,y,'.')
# ボックス選択
region = RectSelect()
plt.show()
# ボックスの左下(blc)と右上(trc)の座標を表示
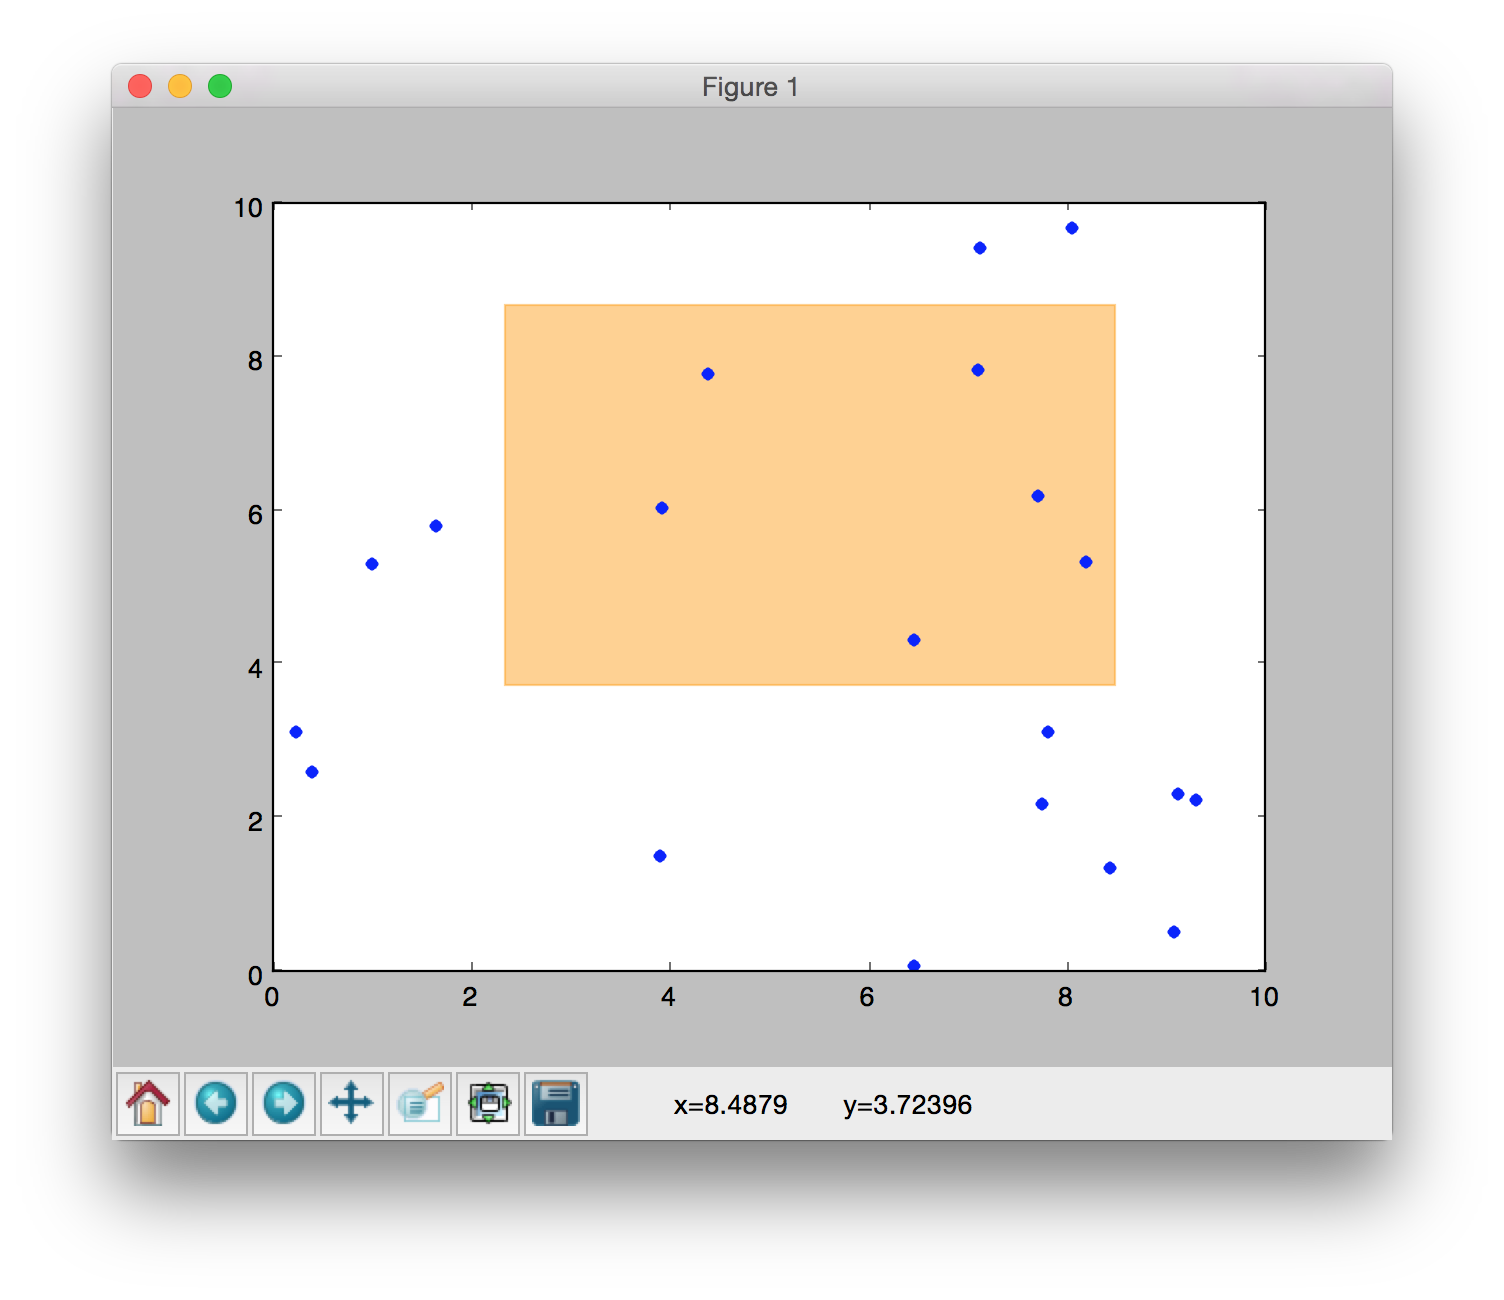
print(region.blc) # --> (2.338709677419355, 3.7239583333333335)
print(region.trc) # --> (8.4879032258064502, 8.671875)
ボックス選択中
選択領域が線で囲まれて表示される。

ボックス選択確定後
選択領域が塗りつぶされて表示される。