はじめに
栃木県のコロナのデータは以下サイトにデータの公開と可視化がされています.
しかし, データはいつ公開されているかはわからず比較的全体的な
データの可視化しかされていません.
そこで, コロナの感染状況のデータを自動的に取得してレポートとして公開する方法を考えましたので
ご覧いただけると幸いです.
※あくまでも, レポートとして公開することを目的としているので内容等の考察は行いません.
また, 今回は栃木県のコロナデータをもとにノートブックアウトプット資料の自動化を行っていますが,
他の形式データでも応用可能なので栃木県のコロナの状況には興味のない人にも適応できる内容かな
と思います.
※これはあくまでも個人で作成したものです.
データセット
上記, URLのExcelデータを使用しています.
使用技術
開発環境
- macbook air (2020) intel
- python3.8(言語)
- jupiter notebook(レポートとして)
- bash
実験環境(運用環境)
- AWS
- EC2(amazon linux2)
- EC2 python 3.7
- lambda(python3.8)
- Systems Manager(Run Command)
- jupiter notebook(レポートとして)
- S3(storage)
- bash
EC2の設定
EC2の初期のtime zone は UTCになっているので
JSTに直すことが必要
※one point
ここは, notebookで日付-1という処理をしてファイル名を出している.
ここがUTCになっていると, 時間によっては日付-1の処理が日本時間とズレる
なので, EC2のtime zoneをJSTに変換する必要がある.
$ sudo timedatectl set-timezone Asia/Tokyo
$ sudo timedatectl status
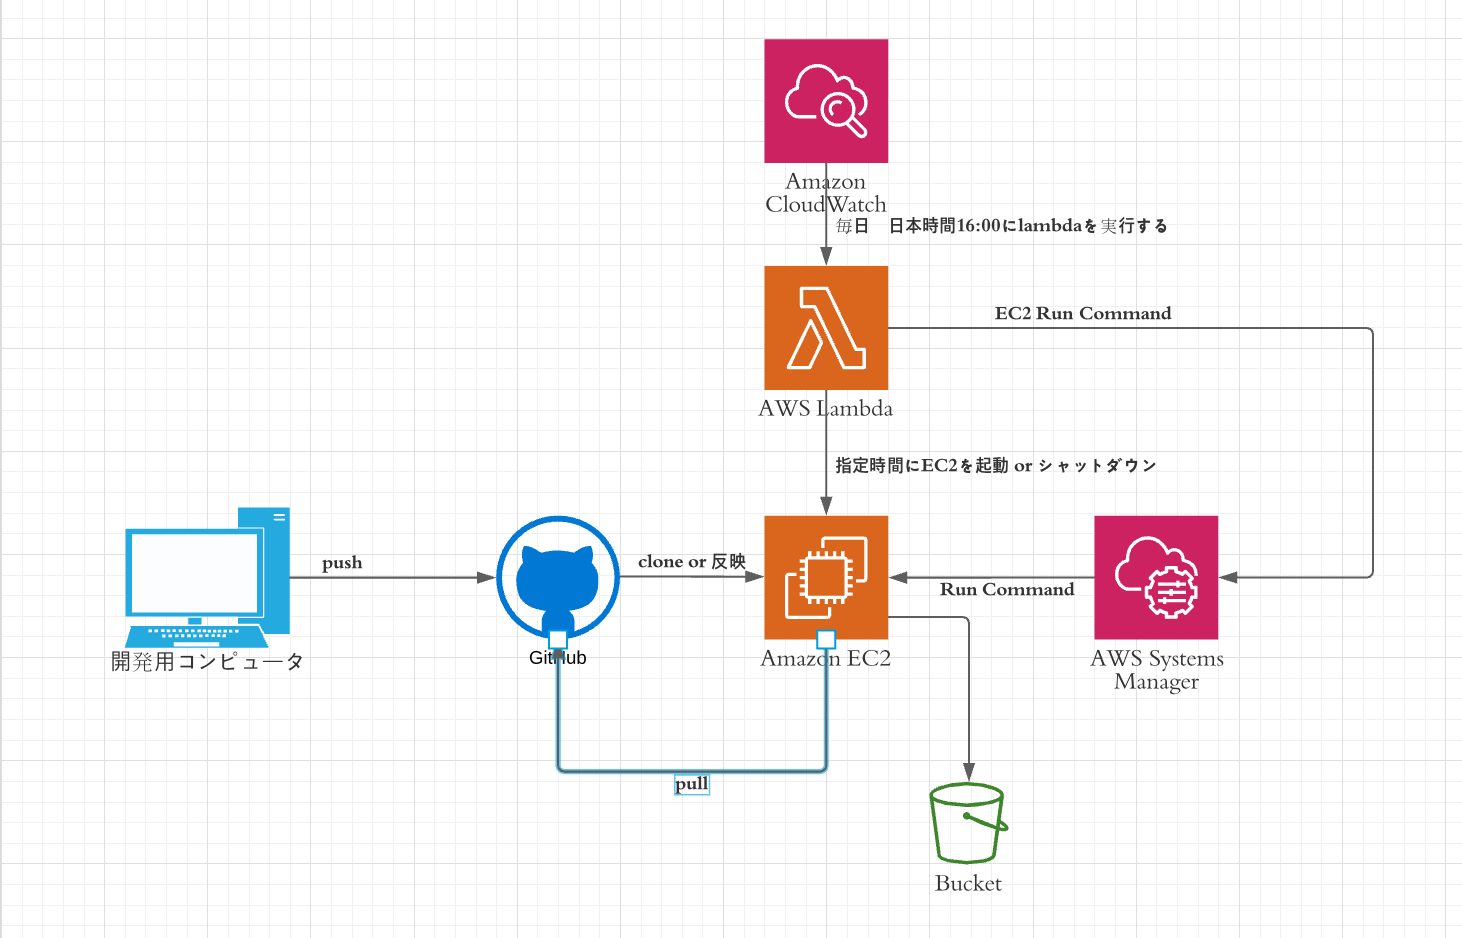
全体構成図(アーキテクチャー図)
システムの概要
- EC2にclone(github)
- EC2のtime zoneの編集(その後EC2をシャットダウンする)
- 指定した時間にlambdaでEC2を起動
- Systems ManagerのRun commandでEC2内にあるbashを実行
※lambdaでbashが実行されるとgit pull が走ってコードが最新になる.
- EC2を落とす(EC2をシャットダウンする)
bashファイル
# !/bin/sh

# git pull
git -C ../../home/ssm-user/corona-bunseki/ pull

# ファイル名をここで決める
to_day=$(date +"%Y%m%d")
echo $to_day
# pipの更新
pip3 install -r ../../home/ssm-user/corona-bunseki/requirements.txt
# python jupiter出力
jupyter nbconvert --execute ../../home/ssm-user/corona-bunseki/test.ipynb --output output/$to_day  --to html
# aws s3アップロード
aws s3 cp ../../home/ssm-user/corona-bunseki/output s3://corona-out-put-log/ --recursive
output(s3)
lambdaの作成
lambdaがどうやって動いているか
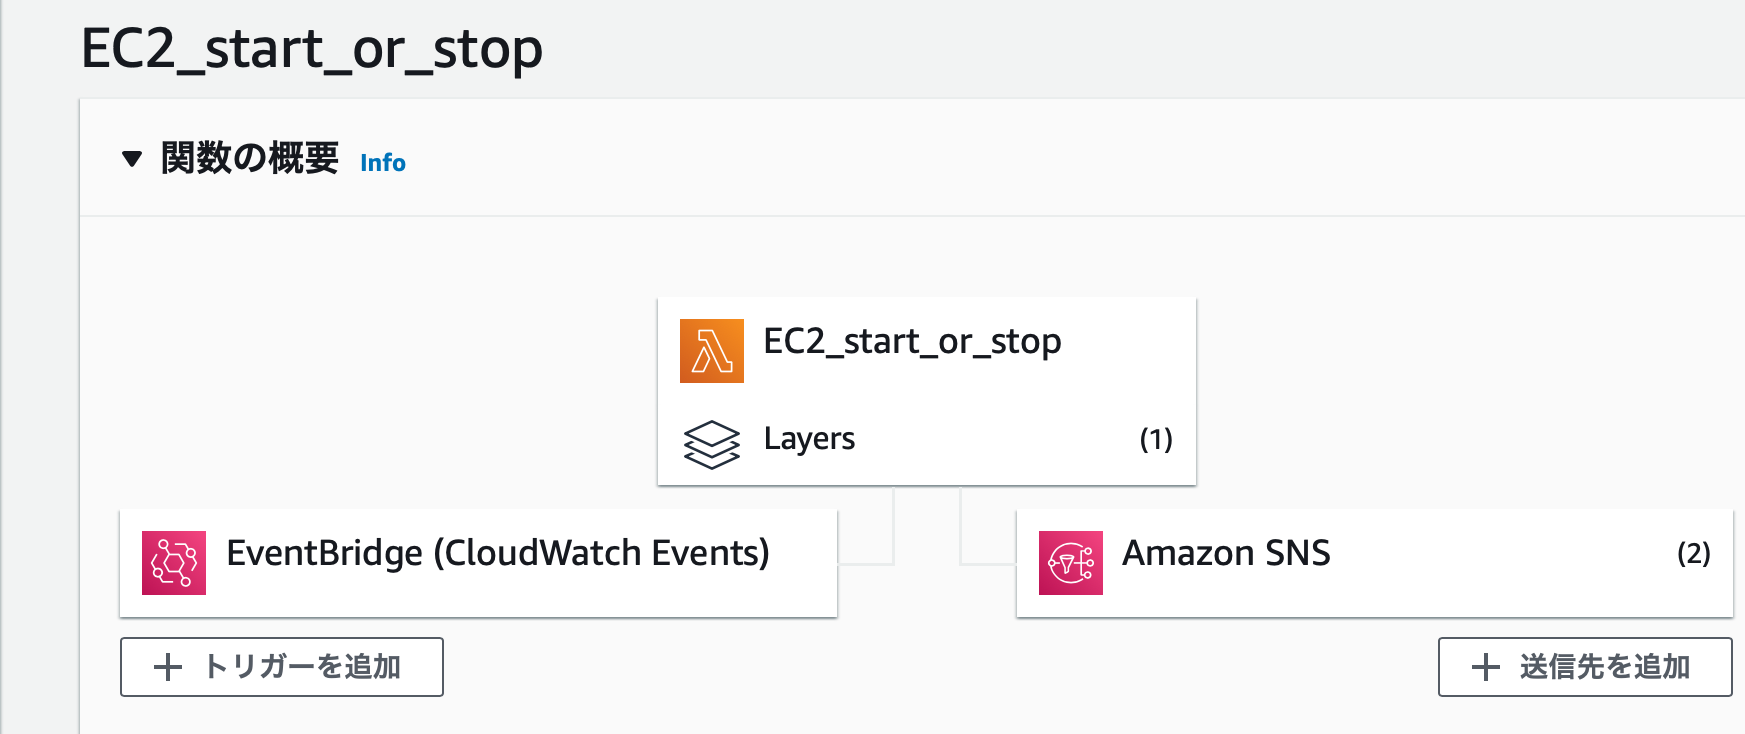
トリガーとしてcloud Watchを使っています.
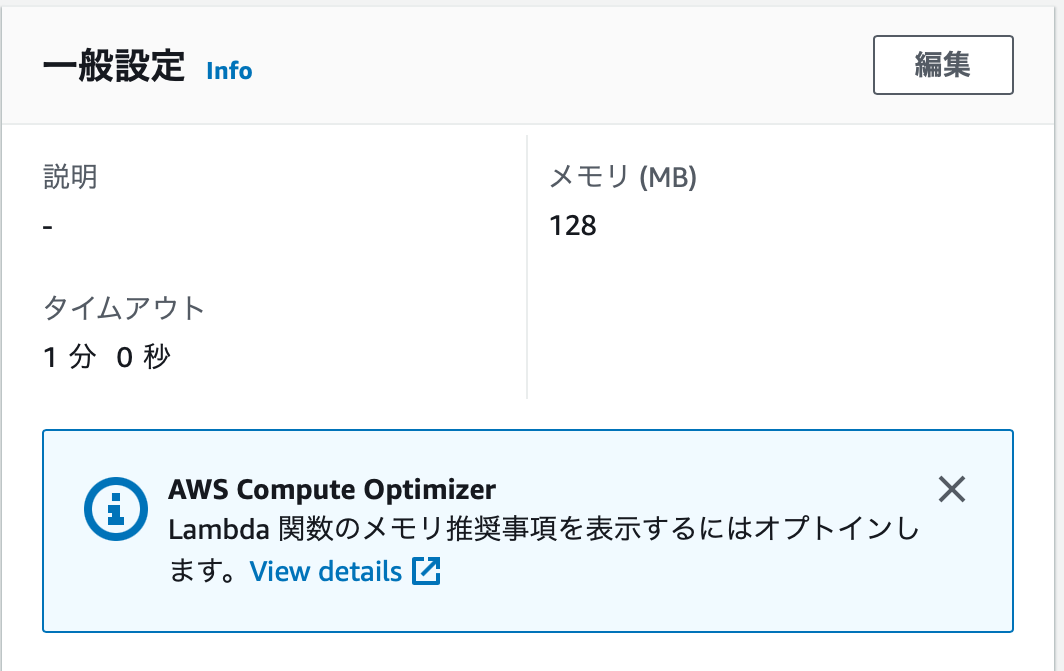
動作としては, 日本時間 毎日16:00にEC2を起動させて Run Commandをさせます.
※one point
lambdaのタイムアウト時間がデフォルトだと30秒なのですが,30秒だと足りないので1分に変更しています.
参考
import boto3
import os
import sys
import time

def ec2_start():
    ec2 = boto3.client('ec2', region_name=os.environ['region'])
    ec2.start_instances(InstanceIds=[os.environ['instance_id']])
    print('Instance ' + os.environ['instance_id'] + ' Started')

def ec2_stop():
    ec2 = boto3.client('ec2', region_name=os.environ['region'])
    ec2.stop_instances(InstanceIds=[os.environ['instance_id']])
    print('Instance ' + os.environ['instance_id'] + ' Stopped')

def ec2_run_command():
    args = sys.argv
    command = "../../home/ssm-user/corona-bunseki/./corona_bash.sh"
    ssm = boto3.client('ssm')
    r = ssm.send_command(
        InstanceIds=[os.environ['instance_id']],
        DocumentName = "AWS-RunShellScript",
        Parameters = {
            "commands": [command]
        }
    )
    command_id = r['Command']['CommandId']
    ## 処理終了待ち
    time.sleep(5)
    res = ssm.list_command_invocations(
          CommandId = command_id,
          Details = True
      )
    invocations = res['CommandInvocations']
    status = invocations[0]['Status']
    if status == "Failed":
        print("Command実行エラー")
    account = invocations[0]['CommandPlugins'][0]['Output']
    print(account)

def main(event, context):
    print('ec2 start')
    ec2_start()
    time.sleep(10)
    print('run_command start')
    ec2_run_command()
    time.sleep(10)
    print('ec2 stop')
    ec2_stop()
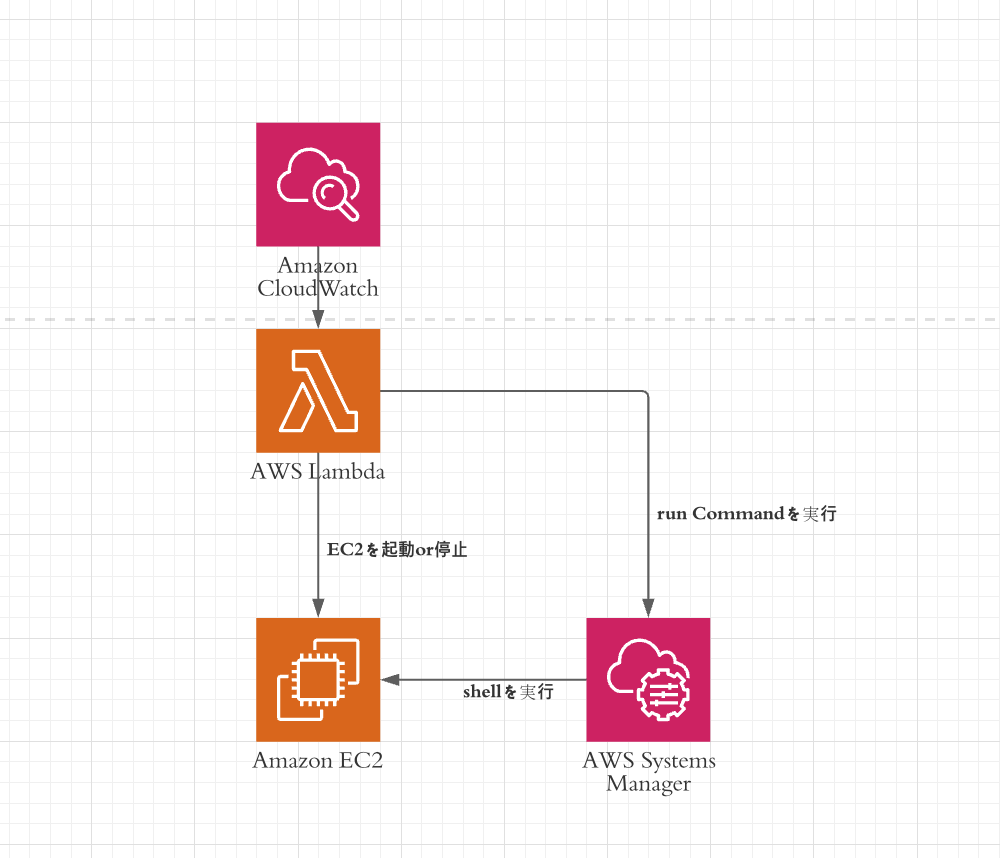
あくまでも処理を図で表してみたもの.
one point!
- lambdaでEC2を動かす時にはIAMの権限設定が必要なので必要に応じて設定してください.
- SSMのrunCommandを実行する際にもEC2にIAMの設定が必要
プログラムの要点(python)
データの取得
dt_now=dt.datetime.now()
file_day=dt_now - dt.timedelta(days=1)
file_day=file_day.strftime("%Y%m%d")
# ファイルのダウンロード
url='https://www.pref.tochigi.lg.jp/e04/welfare/hoken-eisei/kansen/hp/documents/'+str(file_day)+'hasseijoukyou.xlsx'
filename=str(file_day)+'hasseijoukyou.xlsx'
urlData = requests.get(url).content
try:
  if urlData.decode().startswith('<?xml'):
    print('1')
    file_day=dt_now - dt.timedelta(days=1)
    file_day=file_day.strftime("%Y%m%d")
    url='https://www.pref.tochigi.lg.jp/e04/welfare/hoken-eisei/kansen/hp/documents/'+str(file_day)+'hasseijokyou.xlsx'
    filename=str(file_day)+'hasseijoukyou.xlsx'
    urlData = requests.get(url).content
  elif urlData.decode().startswith('<?xml'):
    print('2')
    file_day=dt_now - dt.timedelta(days=2)
    file_day=file_day.strftime("%Y%m%d")
    url='https://www.pref.tochigi.lg.jp/e04/welfare/hoken-eisei/kansen/hp/documents/'+str(file_day)+'hasseijoukyou.xlsx'
    filename=str(file_day)+'hasseijoukyou.xlsx'
    urlData = requests.get(url).content
  elif urlData.decode().startswith('<?xml'):
    print('3')
    file_day=dt_now - dt.timedelta(days=1)
    file_day=file_day.strftime("%Y%m%d")
    url='https://www.pref.tochigi.lg.jp/e04/welfare/hoken-eisei/kansen/hp/documents/'+str(file_day)+'hasseijkyou_1.xlsx'
    urlData = requests.get(url).content
    filename=str(file_day)+'hasseijkyou_1.xlsx'
  elif urlData.decode().startswith('<?xml'):
    print('4')
    file_day=dt_now - dt.timedelta(days=2)
    file_day=file_day.strftime("%Y%m%d")
    url='https://www.pref.tochigi.lg.jp/e04/welfare/hoken-eisei/kansen/hp/documents/'+str(file_day)+'hasseijkyou_1.xlsx'
    urlData = requests.get(url).content
    filename=str(file_day)+'hasseijkyou_1.xlsx'
except:
  print('例外が発生した為プログラムを実行できません.')
with open('data/'+str(filename) ,mode='wb') as f: # wb でバイト型を書き込める
  f.write(urlData)
print(filename)
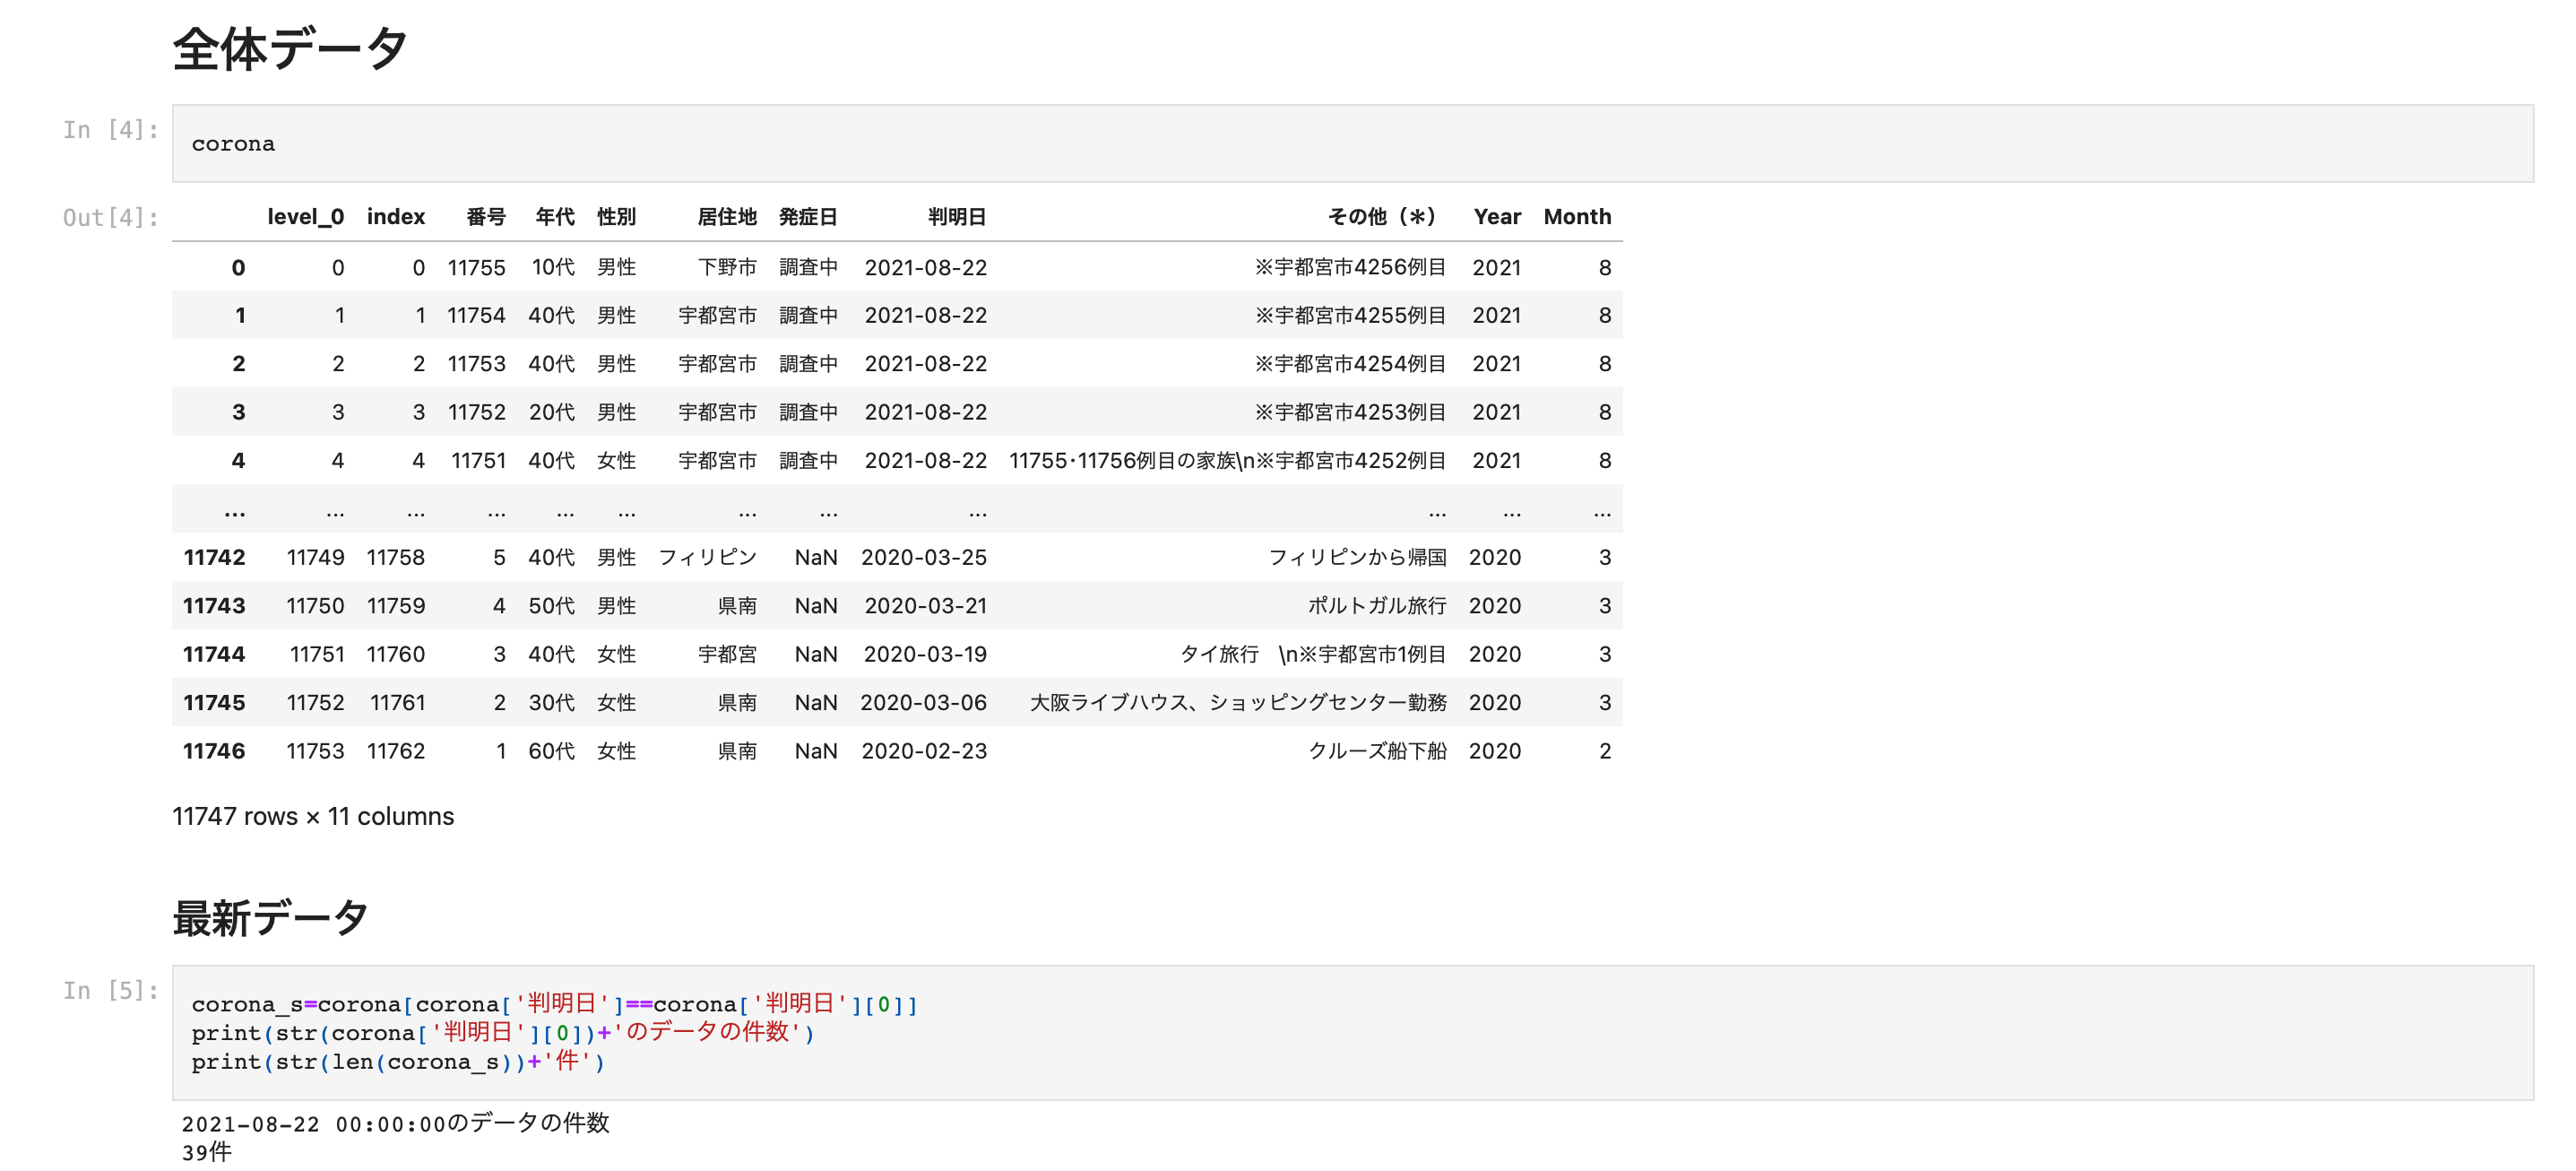
データの読み込み
print(str(filename))
corona=pandas.read_excel('data/'+str(filename), header=1)
※
現状, 栃木県のコロナのデータを読み込むときの問題点は, データが存在しなかった場合ここで
エラーを吐いてしまう.そこをどう解決するかが今後の課題
データの整形
判明日をもとにデータ分析を行うことを想定しています.
※発症日は・調査中・現在調査中が多い為
しかし,判明日についても調査中あるいは現在調査中が存在する為これらのデータは除外しています.
corona=corona[corona['判明日']!='調査中']
corona=corona[corona['判明日']!='現在調査中']
また, 番号カラムがnullになっている場合には, 申請が取り消されている場合なので
番号がnullと全てがnullのデータも除外します.
corona=corona.dropna(how='all')
corona = corona.dropna(axis=0, subset=['番号'])
corona[corona['番号'].isnull()]
corona=corona[corona['番号']!=' ']
corona=corona.reset_index()
エクセルデータをpandasで読み込んだ時日付カラムがシリアル値になる
pandasでExcelデータを読み込んだ時に日付データがシリアル値になってしまう問題が
発生しました.
そこで, これはシリアル値の場合にはtime型に変換します.
for i in range(len(corona)):
    if type(corona['判明日'][i]) is int:
        corona['判明日'][i]=pandas.to_datetime('1900/1/1') + pandas.to_timedelta(corona['判明日'][i] - 1, unit='days')
年データを独立させる
本分析では本年(記事作成時は2021年)のデータを対象としています.
その為, 日付カラムから年データだけを抽出して新しいYearカラムを作成します.
※同様にMonthカラムも作成しています.
corona['Year']=0
corona['Month']=0
corona['判明日']=pandas.to_datetime(corona['判明日'], format='%Y-%m-%d %H:%M:%S')
corona['Year']=corona['判明日'].dt.year
corona['Month']=corona['判明日'].dt.month
分析の概要(sample)
分析は基本的にはpandasの標準機能を利用して可視化を行っています.
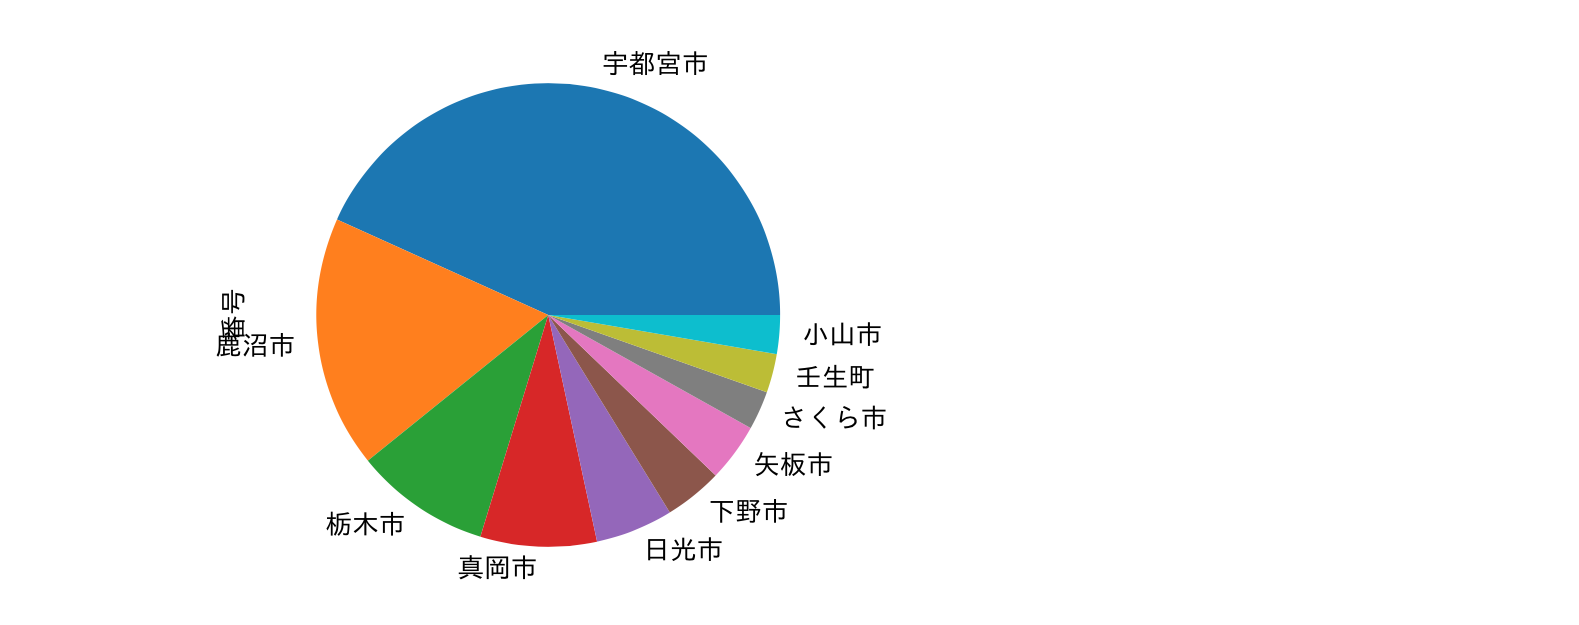
居住地についての可視化
corona_place=corona_s.groupby('居住地').count().sort_values('番号',ascending=False)['番号'][0:10]
corona_place.plot.pie(subplots=True)
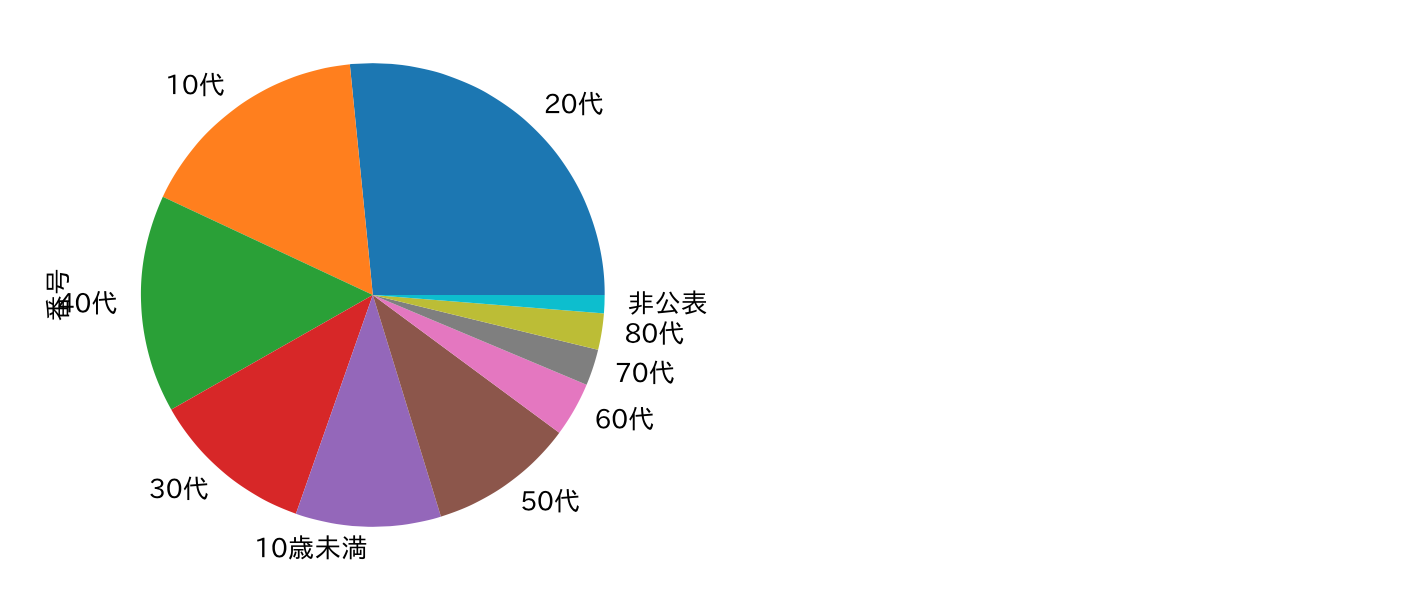
年齢についての可視化
corona_nen=corona_s.groupby('年代').count().sort_values('番号',ascending=False)['番号'][0:10]
corona_nen.plot.pie(subplots=True)
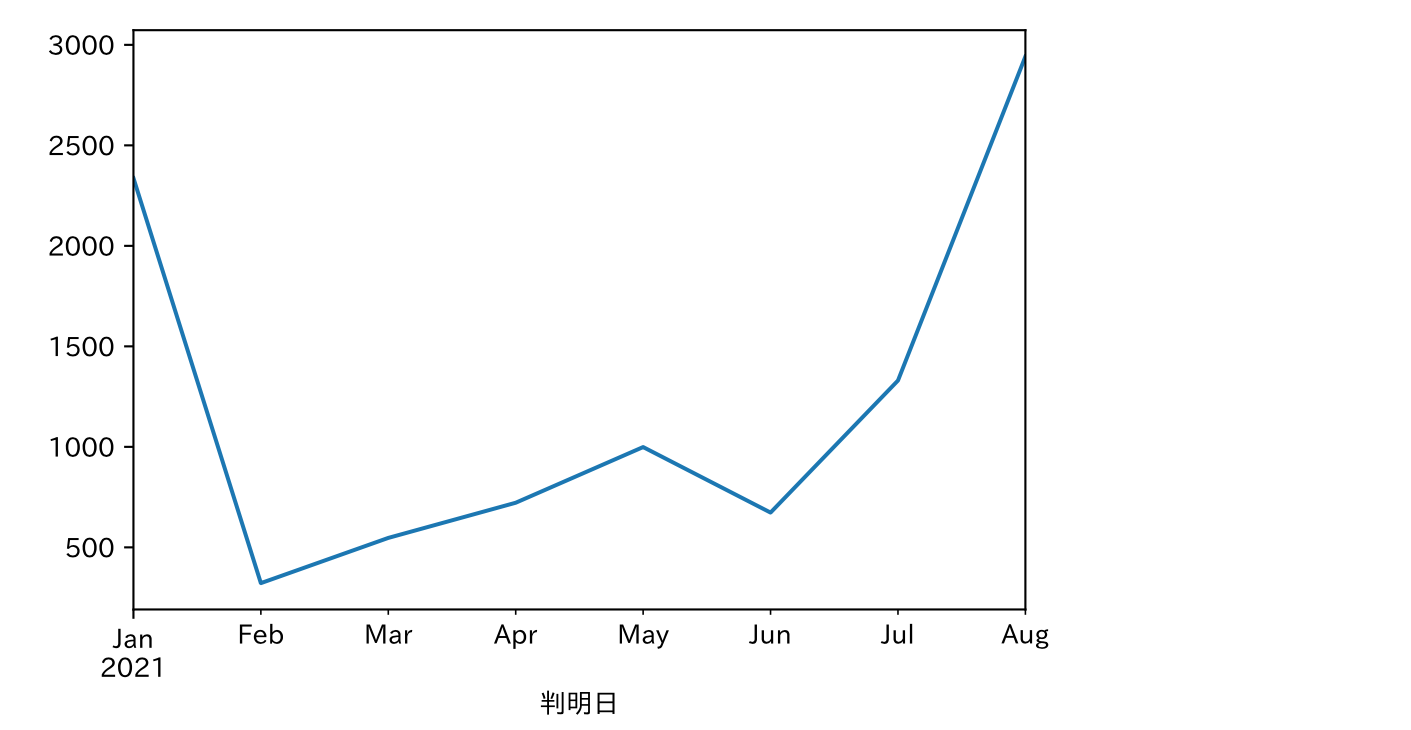
月別コロナ数推移
# 2021年のデータを対象とする.
corona=corona[corona['Year']==2021]
corona.groupby(pandas.Grouper(key='判明日', freq='M')).count()['Year'].plot()
実際に出力されるoutputファイル
今後の課題
現状s3へのアップロードまでは終了していますが
それをどう外へ見せるかが決まっていません
それが今後の課題になりそうです
おわりに
今回は, COVID‑19の発生状況を可視化するレポート自動出力システムの構築を行いました.
もし, 興味がある方はオープンソースとしてコードを公開しているのでさらに良いレポートになっていくと良いなと思います.
コロナが早く落ち着くことを願い記事を終了したいと思います.
