使用しているbokehのバージョンは3.1.0。公式はこちら。
共通する名前
テキスト、色、線、ハッチングは色々なところで設定できる。プロパティの名前はほぼ共通で、頭に場所の名前がつくことがある。fill_color, background_fill_color, border_fill_colorという感じ。
See the Pen Untitled by asitakayosi (@asitakayosi) on CodePen.
捕捉
-
colorの値は文字列、タプル、数値、None。詳細はこちら。
文字列は'black', '#ffffff', 'rgb(255, 255, 255)', 'rgba(255, 255, 255, 0.5)', 'hsl(180 50% 50%)'など。
タプルは(255, 255, 255), (0, 0, 0, 0.5)など。RGB(A)を数値で指定。RGBはintで0~255。Aはfloatで0~1。
数値は16進数表記で0xRRGGBBAA。
Noneは無色。透明度0と同じか。
-
alphaの値はfloatで0から1の間。
-
text_font_sizeの値は文字列。'16px', '1.5rem'など。
-
text_alignの値。'left', 'center', right'
-
text_baselineの値。'top', 'middle', 'bottom', 'alphabetic', 'hanging', 'ideographic'。
-
line_dashの値は文字列かリスト。
文字列は'solid', 'dashed', 'dotted', 'dotdash', 'dashdot'。
または'4 2 6 2'のような形。リストの値は点線の点と空白の長さを表すint。
[4, 2, 6, 2]のような形。値が奇数個だとリストを2倍にして偶数個にする。[3, 2, 5]は[3, 2, 5, 3, 2, 5]になる。[]で実線。 -
line_capは線の端の形。'butt', 'round', 'square'。
-
line_joinは線の結合点の形。'miter', 'round', 'bevel'。
-
hatch_patternには略記もある。
一覧
名前 略記 blank " " dot "." ring "o" horizontal_line "-" vertical_line "|" cross "+" horizontal_dash '"' vertical_dash ":" spiral "@" right_diagonal_line "/" left_diagonal_line "\\" diagonal_cross "x" right_diagonal_dash "," left_diagonal_dash "`" horizontal_wave "v" vertical_wave ">" criss_cross "*" -
hatch_extra
from bokeh.plotting import ColumnDataSource, figure, output_notebook, row, show

output_notebook()
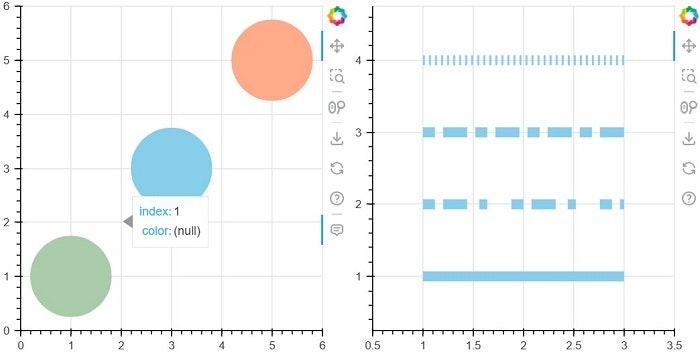
# 色
# 透明度 0でもHoverToolは反応する
data = dict(
    x=[1, 2, 3, 4, 5],
    y=[1, 2, 3, 4, 5],
    color=['#aaccaa', None, 'skyblue', (0, 0, 0, 0), 0xffaa88ff],
)
source = ColumnDataSource(data)

p1 = figure(width=350, height=350,
            tooltips=[('index', '$index'),('color', '$color:color')])
p1.x_range.range_padding = p1.y_range.range_padding = 0.5

p1.circle(
    x='x', y='y', size=80,
    source=source,
    color='color',  # colorはfill, line, hatchの色をまとめて変更する引数。
)

# line_dash
# 空のリストで実線
data = dict(
    xs=[[1, 3], [1, 3], [1, 3], [1, 3]],
    ys=[[4, 4], [3, 3], [2, 2], [1, 1]],
    line_dash=['dotted', '12 8 24 8', [12, 8, 24], []]
)
source = ColumnDataSource(data)

p2 = figure(width=350, height=350)
p2.x_range.range_padding = p2.y_range.range_padding = 0.5

p2.multi_line(
    xs='xs', ys='ys',
    source=source,
    line_width=10,
    line_color='skyblue',
    line_dash='line_dash',
)

show(row(p1, p2))
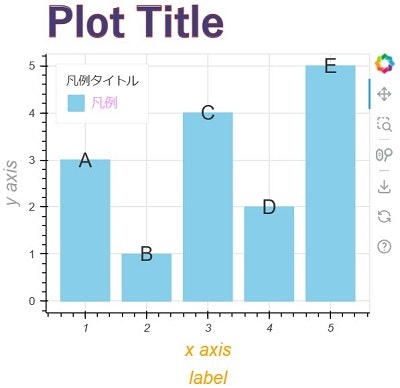
色々な場所のtextプロパティ
data = dict(
    x=[1, 2, 3, 4, 5],
    y=[3, 1, 4, 2, 5],
    text=list('ABCDE')
)

source = ColumnDataSource(data)

p = figure(width=400, height=400, title='Plot Title',
           x_axis_label='x axis\nlabel', y_axis_label='y axis')

p.vbar(
    x='x', width=0.8, top='y',
    source=source,
    color='skyblue',
    legend_label='凡例',
)

p.text(
    x='x', y='y', text='text',
    source=source,
    text_font_size='20px',
    text_color='#333333',
    text_align='center',
    text_baseline='middle',
)

# 凡例
p.legend.location = 'top_left'
p.legend.label_text_color = '#ee88eedd'

p.legend.title = '凡例タイトル'
p.legend.title_text_font_size = '12px'

# タイトル
p.title.text_font = 'yu gothic'
p.title.text_font_size = '40px'
p.title.text_color = '#314288'
p.title.text_outline_color = 'brown'

# xy軸
p.axis.axis_label_text_font_size = '18px'

# x軸
p.xaxis.axis_label_text_color = 'orange'
p.xaxis.axis_label_text_line_height = 1.4
p.xaxis.major_label_text_font_style = 'italic'

# y軸
p.yaxis.axis_label_text_alpha = 0.5

show(p)
色々な場所のlineプロパティ
from bokeh.transform import linear_cmap

data = dict(
    x=[1, 1, 2, 2, 3, 3],
    y=[1, 2, 1, 2, 1, 2],
    value=[1, 2, 3, 4, 5, 6]
)
source = ColumnDataSource(data)

p1 = figure(width=350, height=350, match_aspect=True,
            title='Plot Example', tools='', toolbar_location=None)

r = p1.rect(
    x='x', y='y', width=1, height=1,
    source=source,
    fill_color=linear_cmap('value', low=1, high=7, palette='Greens6'),
    line_color='#224122',
    line_width=3,
    line_cap='round'
)

# カラーバー
color_bar = r.construct_color_bar(
    border_line_color='orange',
    bar_line_color='crimson',
    bar_line_width=2,
    bar_line_dash=[8, 2],
    major_tick_line_color='#222299',
    major_tick_line_width=3,
    location=(10, 0),
)
p1.add_layout(color_bar, 'right')

# タイトル
p1.title.border_line_color = 'navy'

# x軸
p1.xaxis.axis_line_color = 'plum'
p1.xaxis.axis_line_width = 3

# y軸
p1.yaxis.major_tick_line_width = 3
p1.yaxis.minor_tick_line_width = 2
p1.yaxis.minor_tick_line_color = '#44f'

p2 = figure(width=350, height=350, match_aspect=True)

p2.line(
    x='x', y='y',
    source=source,
    line_width=10,
    line_color='#98d',
    line_join='miter',
    line_cap='round',
    legend_label='線1'
)

# アウトライン
p2.outline_line_width = 3
p2.outline_line_color = 'darkgreen'

# xyグリッド
p2.grid.grid_line_width = 3

# xグリッド
p2.xgrid.grid_line_color = 'bisque'

# yグリッド
p2.ygrid.minor_grid_line_color = '#dadada'
p2.ygrid.minor_grid_line_dash = 'dotted'

# xy軸
p2.axis.axis_line_color = None

# 凡例
p2.legend.border_line_color = 'black'

show(row(p1, p2))

色々な場所のfill, hatchプロパティ
from bokeh.models import BoxAnnotation
from bokeh.palettes import GnBu5

data = dict(
    x=[1, 2, 3, 4, 5],
    y=[3, 1, 4, 2, 5],
    fill_color=GnBu5,
    hatch_pattern=['|', '/', '>', 'x', '-']
)
source = ColumnDataSource(data)

p = figure(
        width=400, height=400,
        background_fill_color='#fcfcfc',
        background_fill_alpha=0.8,
        border_fill_color='lightgrey',
        tools='hover',
)
p.x_range.range_padding = p.y_range.range_padding = 0.5

p.circle(
    x='x', y='y', size=50,
    source=source,
    fill_color='fill_color',
    hatch_pattern='hatch_pattern',
    hatch_color='darkgreen',
    hatch_scale=8,
    hover_fill_color='#7654',
    hover_hatch_pattern=',',
)

box = BoxAnnotation(
    top=2, bottom=1,
    fill_color='red',
    fill_alpha=0.1,
    hatch_pattern='@',
    hatch_alpha=0.1,
    hatch_scale=20,
    hatch_weight=3
)

p.add_layout(box)

show(p)
