複数のグラフやウィジェットを並べるのに使うレイアウトとsizing_modeについての簡単なまとめ。
bokehのバージョンは2.4.1。jupyterlabのバージョンは3.1.4。
レイアウトに関する公式ドキュメントはこちら。
レイアウトの作成
bokeh.layoutsの関数を使う。
from bokeh.plotting import figure, output_notebook, show
from bokeh.layouts import column, row, layout, gridplot
from bokeh.models import Spacer
from bokeh.palettes import Pastel1_9

output_notebook()

# プロットを作る関数を定義

def make_plots(texts=list('ABC'), **kwargs):
    plots = []
    for text, color in zip(texts, Pastel1_9):
        p = figure(
                x_axis_type=None,
                y_axis_type=None,
                tools='reset, save',
                toolbar_location=None,
                background_fill_color=color + 'aa',  # 透明度を追加
                border_fill_color=color,
                **kwargs
        )
        p.text(
            x=0,
            y=0,
            text=[text],
            text_font_size='40px',
            text_align='center',
            text_baseline='middle',
        )
        plots.append(p)

    return plots
row
横一列に並べる。
plots = make_plots(width=200, height=200)

l = row(*plots, background='grey', spacing=10)

show(l)
column
縦一列に並べる。
plots = make_plots(width=200, height=200, margin=10)

l = column(*plots, width=240, height=660, background='grey')

show(l)
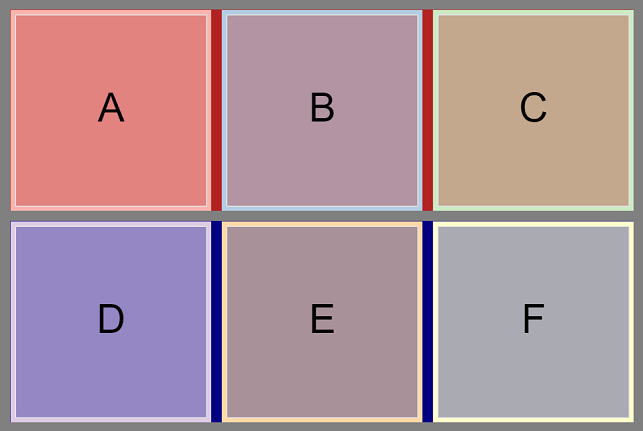
# rowとcolumnを組み合わせる

plots = make_plots(texts=list('ABCDEF'), width=200, height=200)

l1 = row(*plots[:3], background='firebrick', spacing=10, margin=10)
l2 = row(*plots[3:], background='navy', spacing=10, margin=(0, 10, 10, 10))

l = column(l1, l2, background='grey')

show(l)
layout
2次元リストを使って縦横の格子状に配置する。空白をつくる時はSpacerを利用。
plots = make_plots(width=200, height=200)

a, b, c = plots[0], plots[1], plots[2]
children = [[a, b],
            [Spacer(width=200, height=200), c]]
l = layout(children, spacing=10, background='grey')

show(l)
gridplot
2次元リストを使って縦横の格子状に配置する。Noneで空白を作れる。ツールバーはひとつになる。merge_tools=Falseでひとつにしない。リストで渡して列の数を指定することもできる。
from bokeh.palettes import Pastel1_9

plots = make_plots(texts=list('ABC'))

a, b, c = plots[0], plots[1], plots[2]
children = [[a, b],
            [None, c]]
g = gridplot(children, width=120, height=120)

show(g)
# toolbar_location=Noneでツールバー非表示。

plots = make_plots(texts=list('ABCDEFGHI'))

g = gridplot(plots, ncols=3, width=120, height=120, toolbar_location=None)
g.spacing = 12
g.background = 'grey'

show(g)
sizing_modeの設定
グラフやレイアウトのサイズ変化に関する設定。デフォルトはNone。
'fixed'は固定。
'stretch_width', 'stretch_height', 'stretch_both'はプロットの形を維持しない可変。
'scale_width', 'scale_height', 'scale_both'はプロットの形を維持して可変。
Noneは親要素のsizing_modeの影響を受ける。
異なるsizing_modeをもつ複雑なレイアウトをつくると
パフォーマンスと見た目の両方で悲しい結果になるかもしれないといった感じの記述が公式にあるので、
# sizing_mode用のプロット作成関数

def make_plots(texts, **kwargs):
    plots = []
    for text, color in zip(texts, Pastel1_9):
        sizing_mode = text
        if text == 'None':
            sizing_mode = None

        p = figure(
                x_axis_type=None,
                y_axis_type=None,
                tools='',
                toolbar_location=None,
                background_fill_color=color + 'aa',
                border_fill_color=color,
                sizing_mode=sizing_mode,
                **kwargs
        )
        p.text(
            x=0,
            y=0,
            text=[text],
            text_font_size='40px',
            text_align='center',
            text_baseline='middle',
        )
        plots.append(p)

    return plots

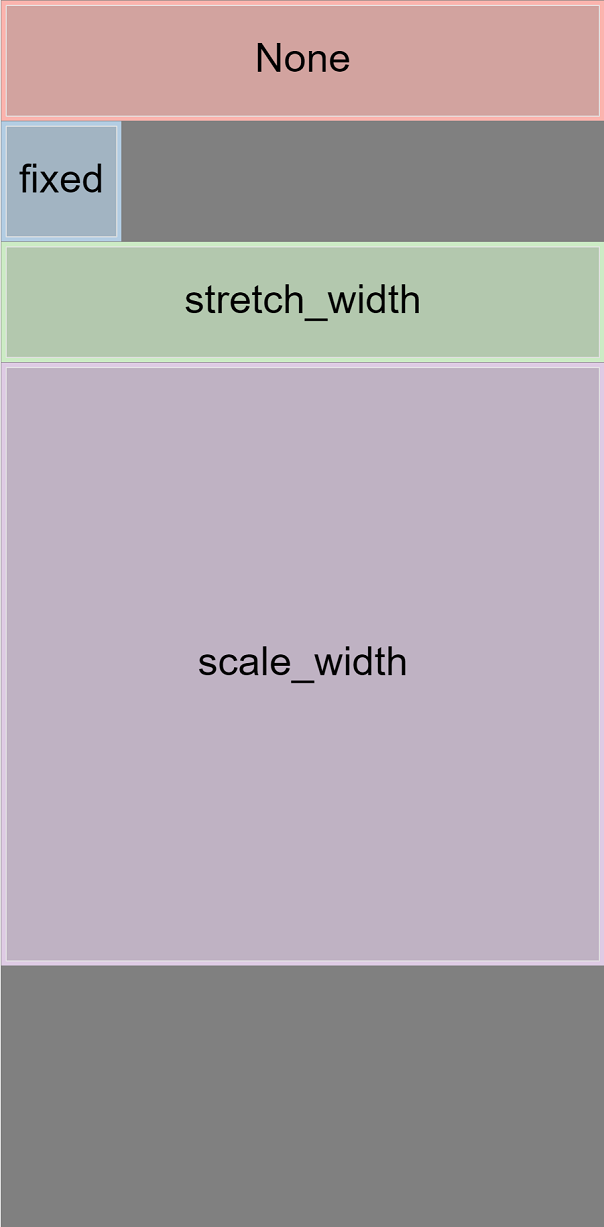
texts = ['None', 'fixed', 'stretch_width', 'scale_width']
# 親要素が'fixed'

plots = make_plots(texts, width=120, height=120)

l = column(*plots, sizing_mode='fixed', width=240, height=600, background='grey')

show(l)
# 親要素が'stretch_width'
# min_width, max_widthを設定すると幅の範囲を限定できる。
# 子要素にscale_〇〇があると高さはウィンドウの幅に応じて増減する。
# 幅が最大最小幅で止まっても高さは変化し続けるので表示崩れの原因になる。

plots = make_plots(texts, width=120, height=120)

l = column(*plots, sizing_mode='stretch_width', min_width=550, max_width=600, background='grey')

show(l)
# 親要素が'scale_both'
# 幅と高さ両方を設定するとおかしくならない。

plots = make_plots(texts, width=120, height=120)

l = column(*plots, sizing_mode='scale_both', max_height=1040, max_width=400, background='grey')

show(l)


