この記事では、Bluemix 3rd Party製品として登録されているクラウド型の監視ツールNew Relicを用いてBluemix Infrastructure (旧SoftLayer)の仮想サーバーおよびBluemixのPHPランタイムを監視する方法について説明します。
New Relicとは
New Relic,Inc. (NYSE: NEWR) はアメリカサンフランシスコに拠点を置くソフトウェア・アナリティクスの会社です。2008年に創業した New Relic は Software as a Service (Saas) モデルにて Web アプリケーションのみならず Web のモニタリング、モバイルアプリケーションなどをリアルタイムでクラウド送信し、瞬時にデータ分析を行えるプラットフォームサービスを提供しています。世界中の名だたる企業が、今 New Relic を活用しています。(出典:New Relic日本代理店Degica様)

Buemixからすぐに使えるNew Relic
New Relicは、Bluemixの3rd Partyサービスとして登録されていますので、Bluemixアカウントをお持ちであればすぐに利用することができます。
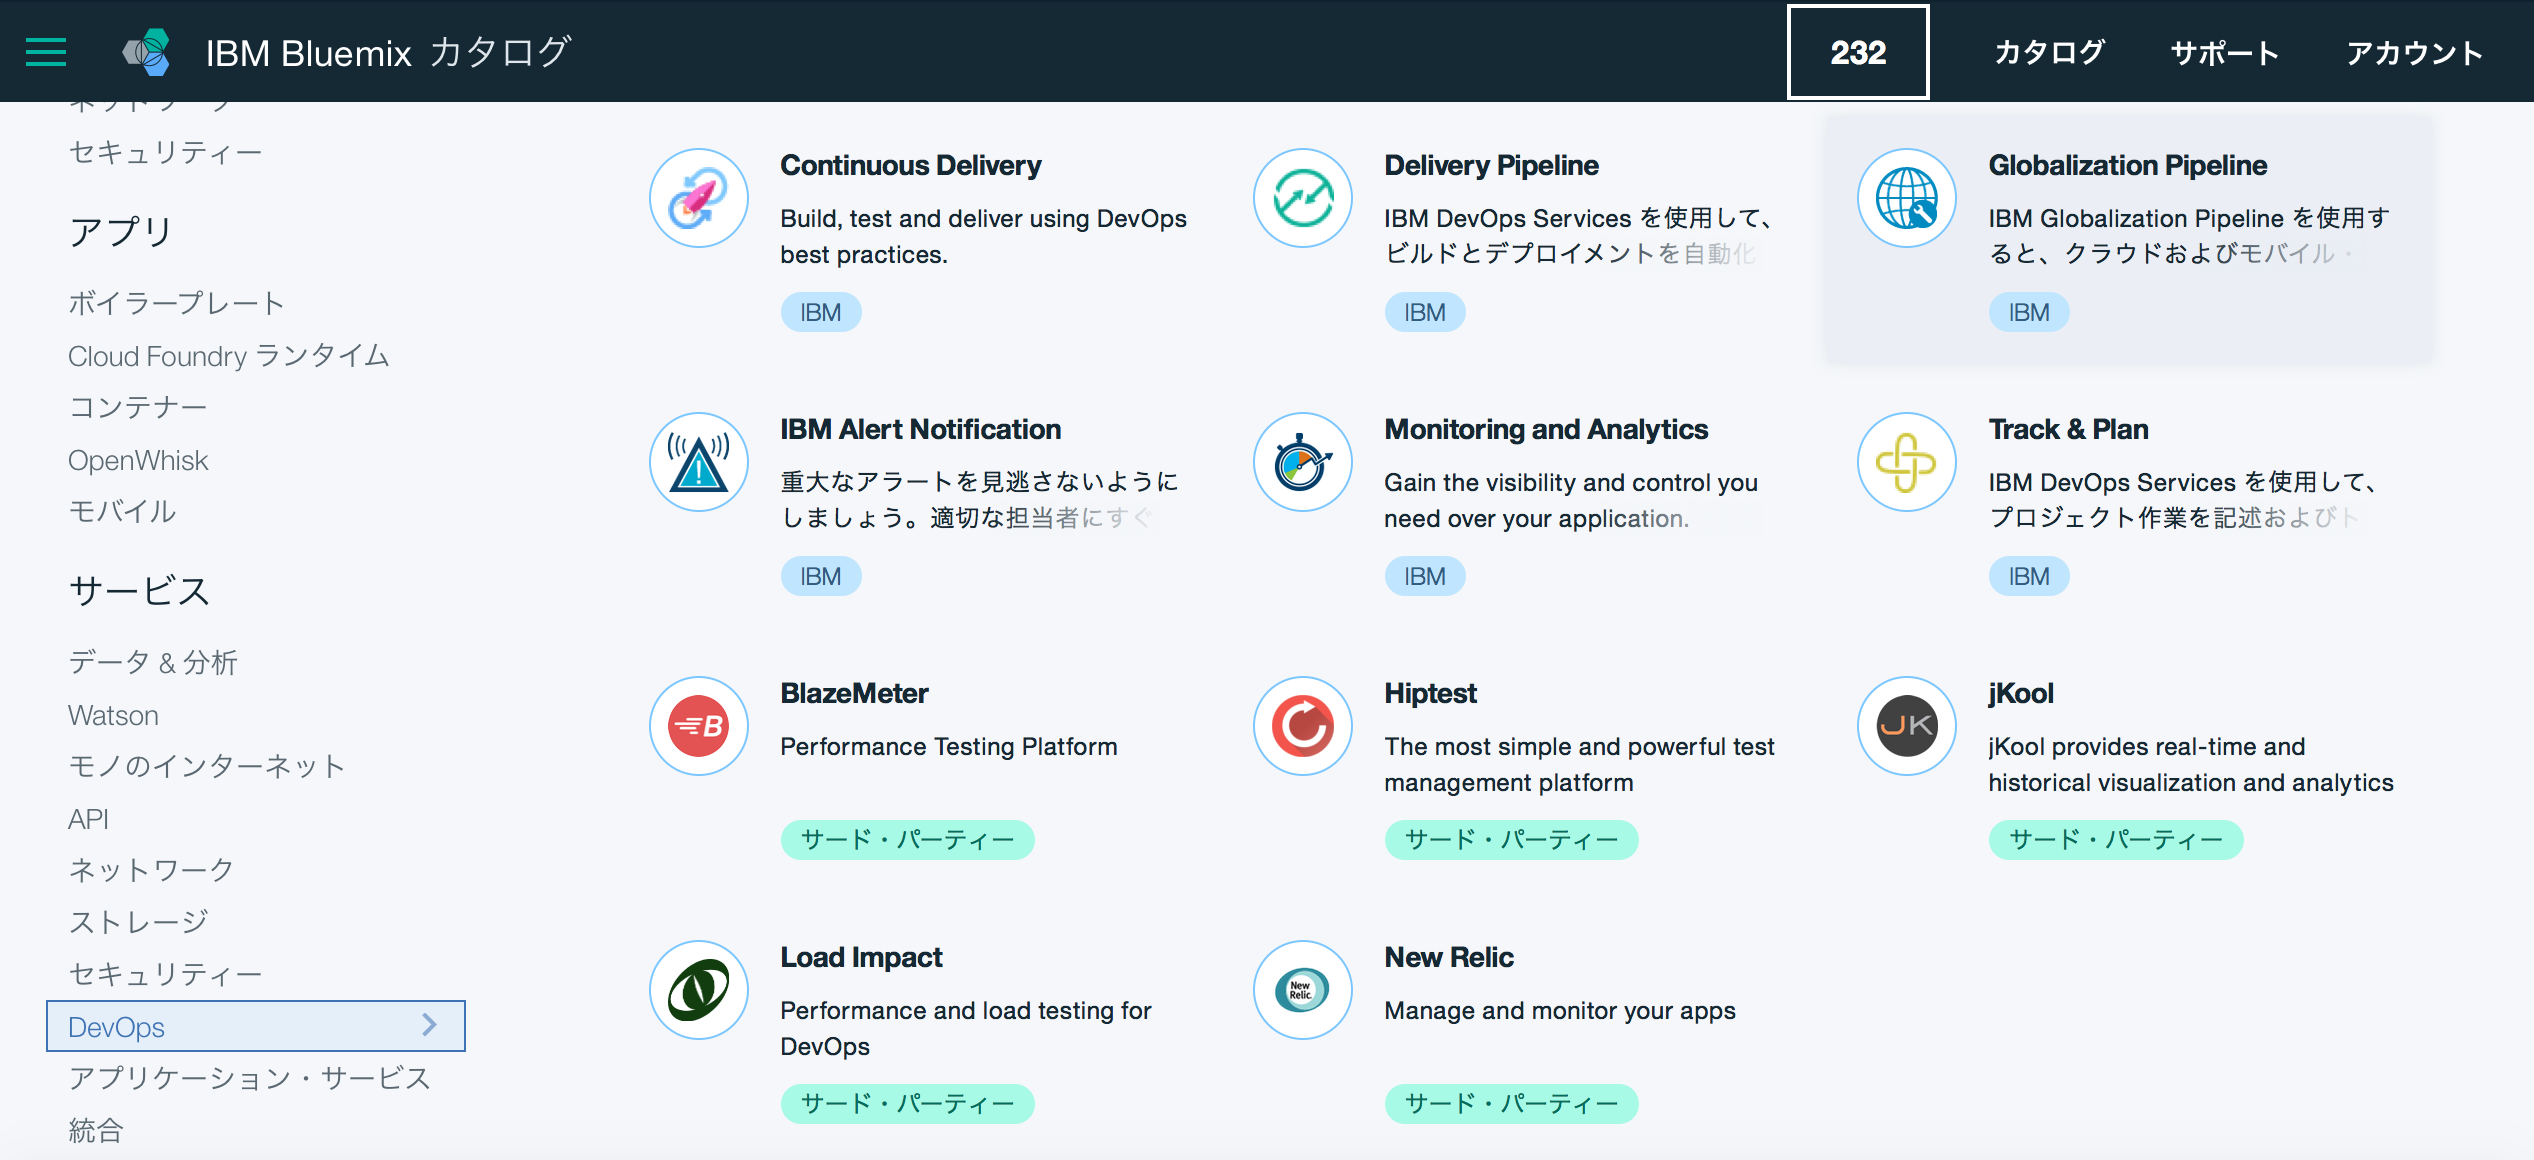
IBM Bluemixカタログ
早速、BluemixからNew Relicをオーダーし、Bluemix Infrastructure (旧SoftLayer)の仮想サーバー(Public VSI)を監視してみましょう。最初に、以下のリンクよりBluemixのカタログを表示します。New Relicは、DevOpsカテゴリにあります。
https://console.ng.bluemix.net/catalog/
New Relicのオーダー
カテゴリからNew Relicを選択しクリックします。
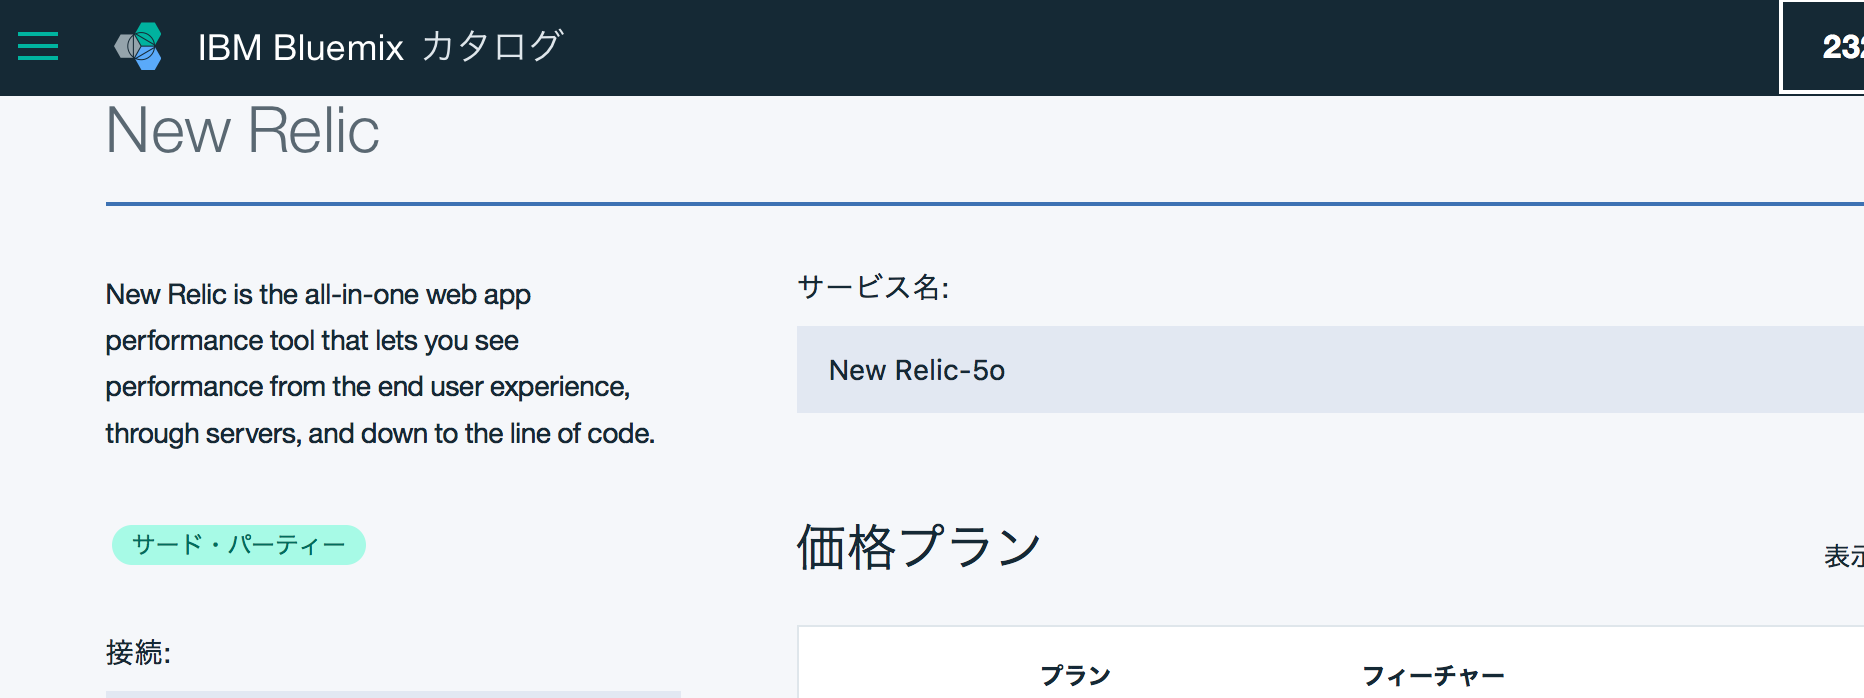
Bluemix上のサービス名が自動で入力されますので、このまま作成ボタンをクリックします。価格はこの時点では、Standard Planのみ(無料)です。
NEW RELICダッシュボードを開く
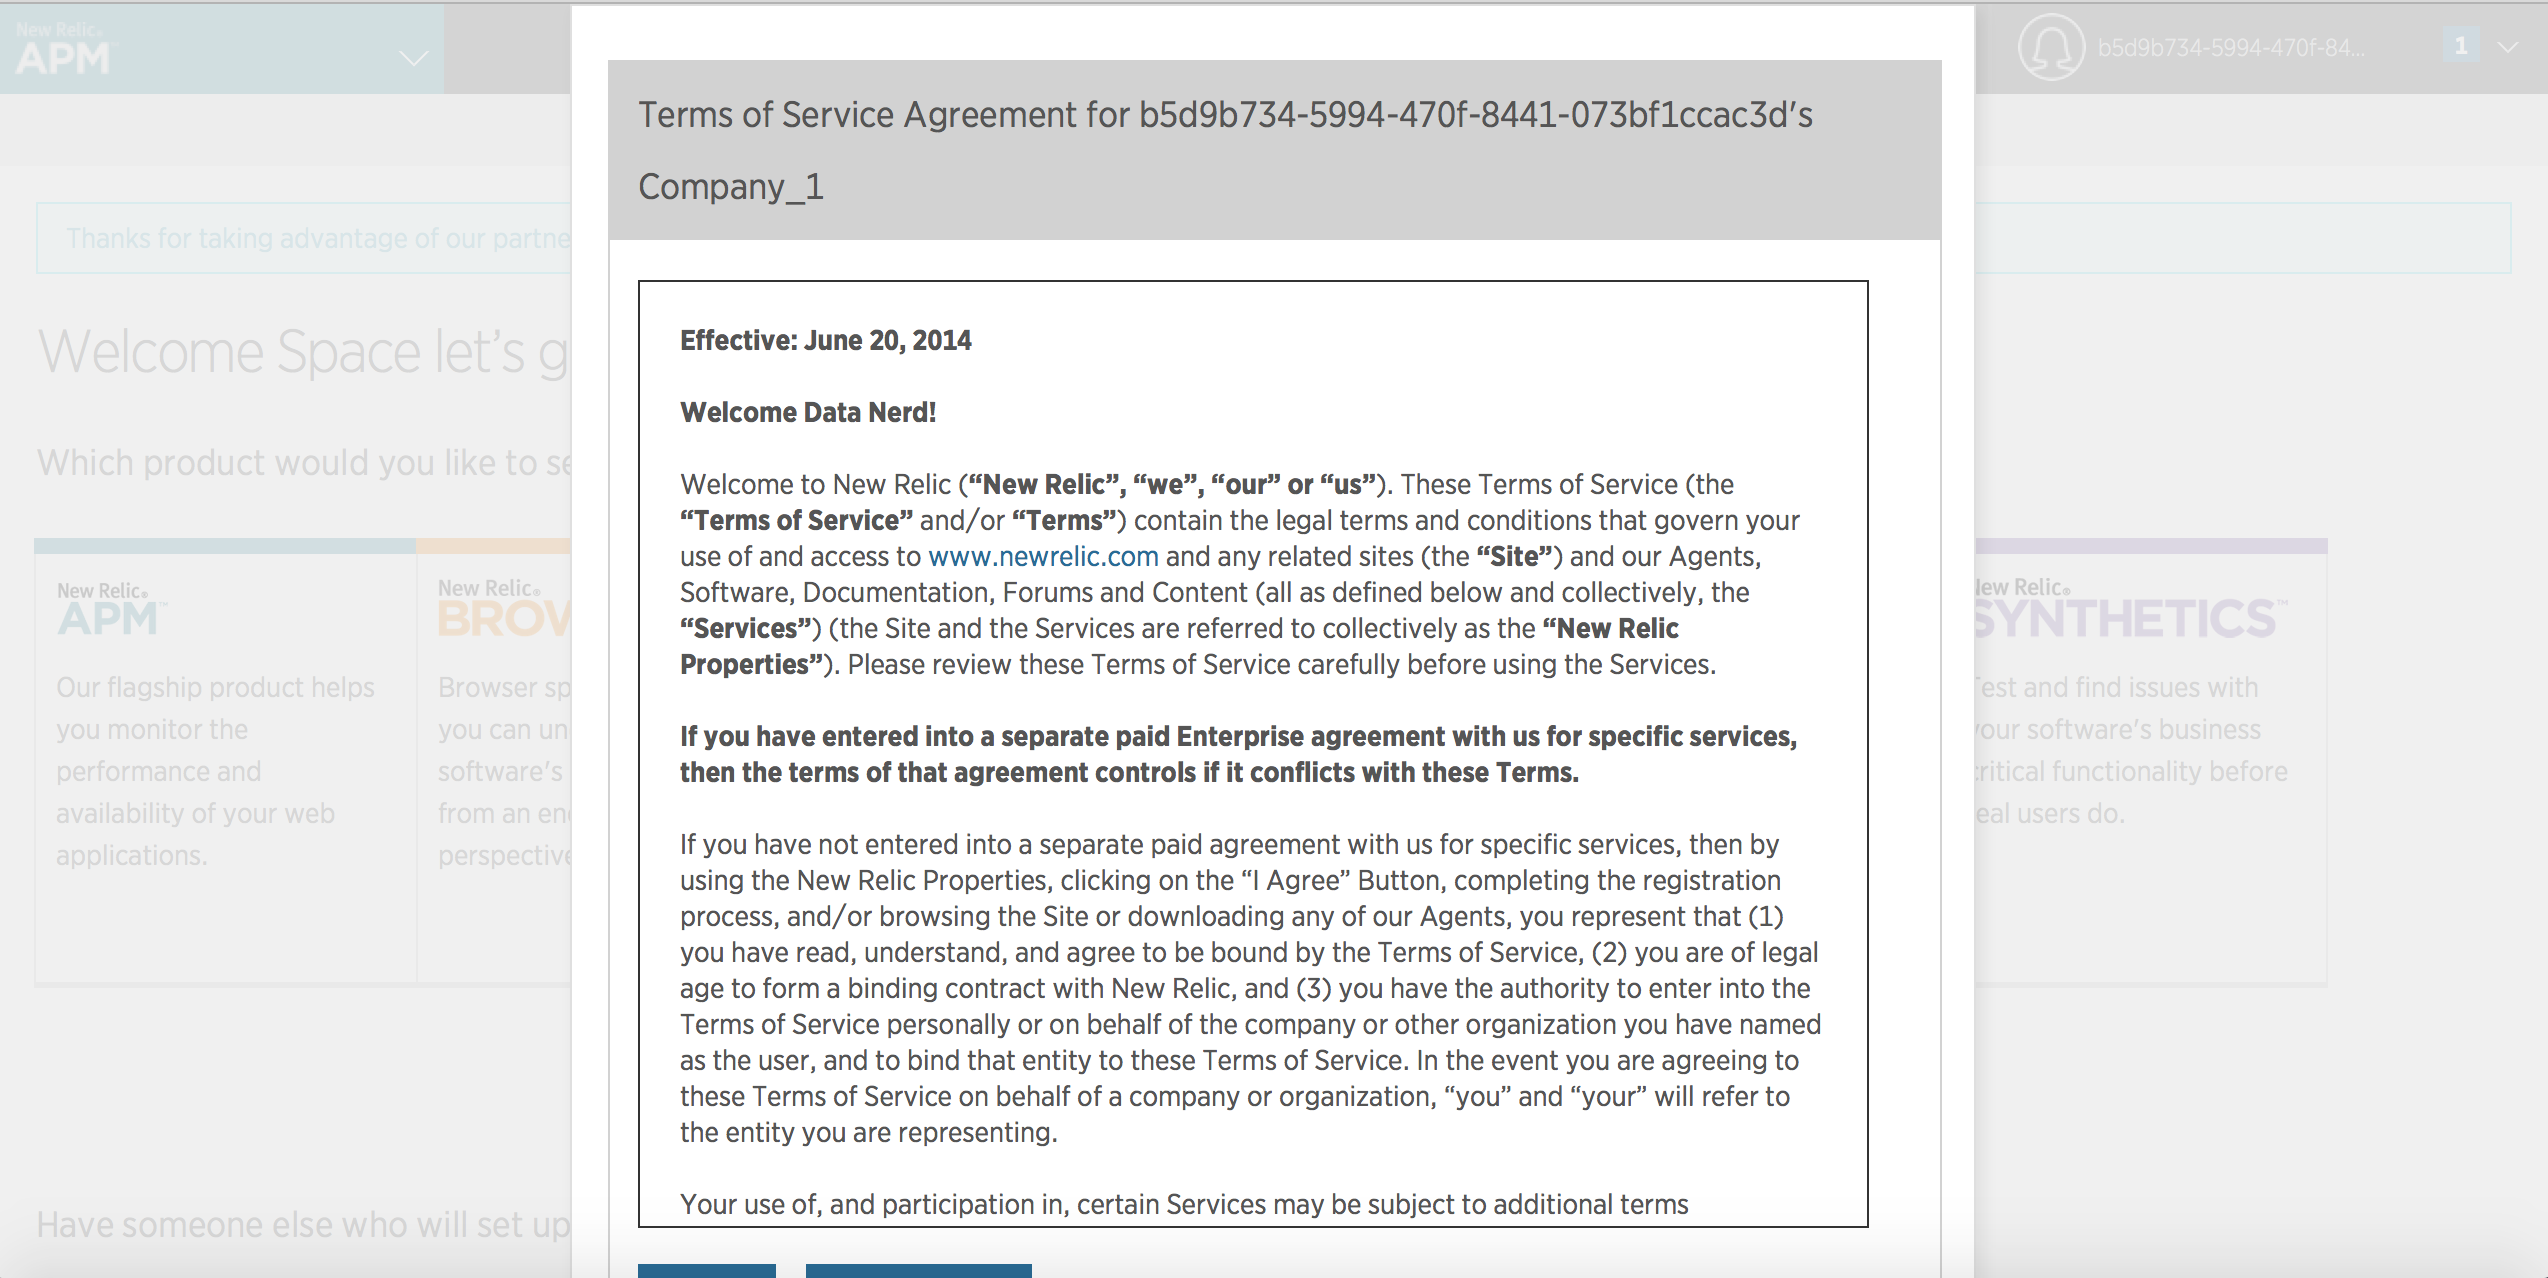
数秒経過するとダッシュボードのリンクが使用可能になりますのでダッシュボードを開きます。
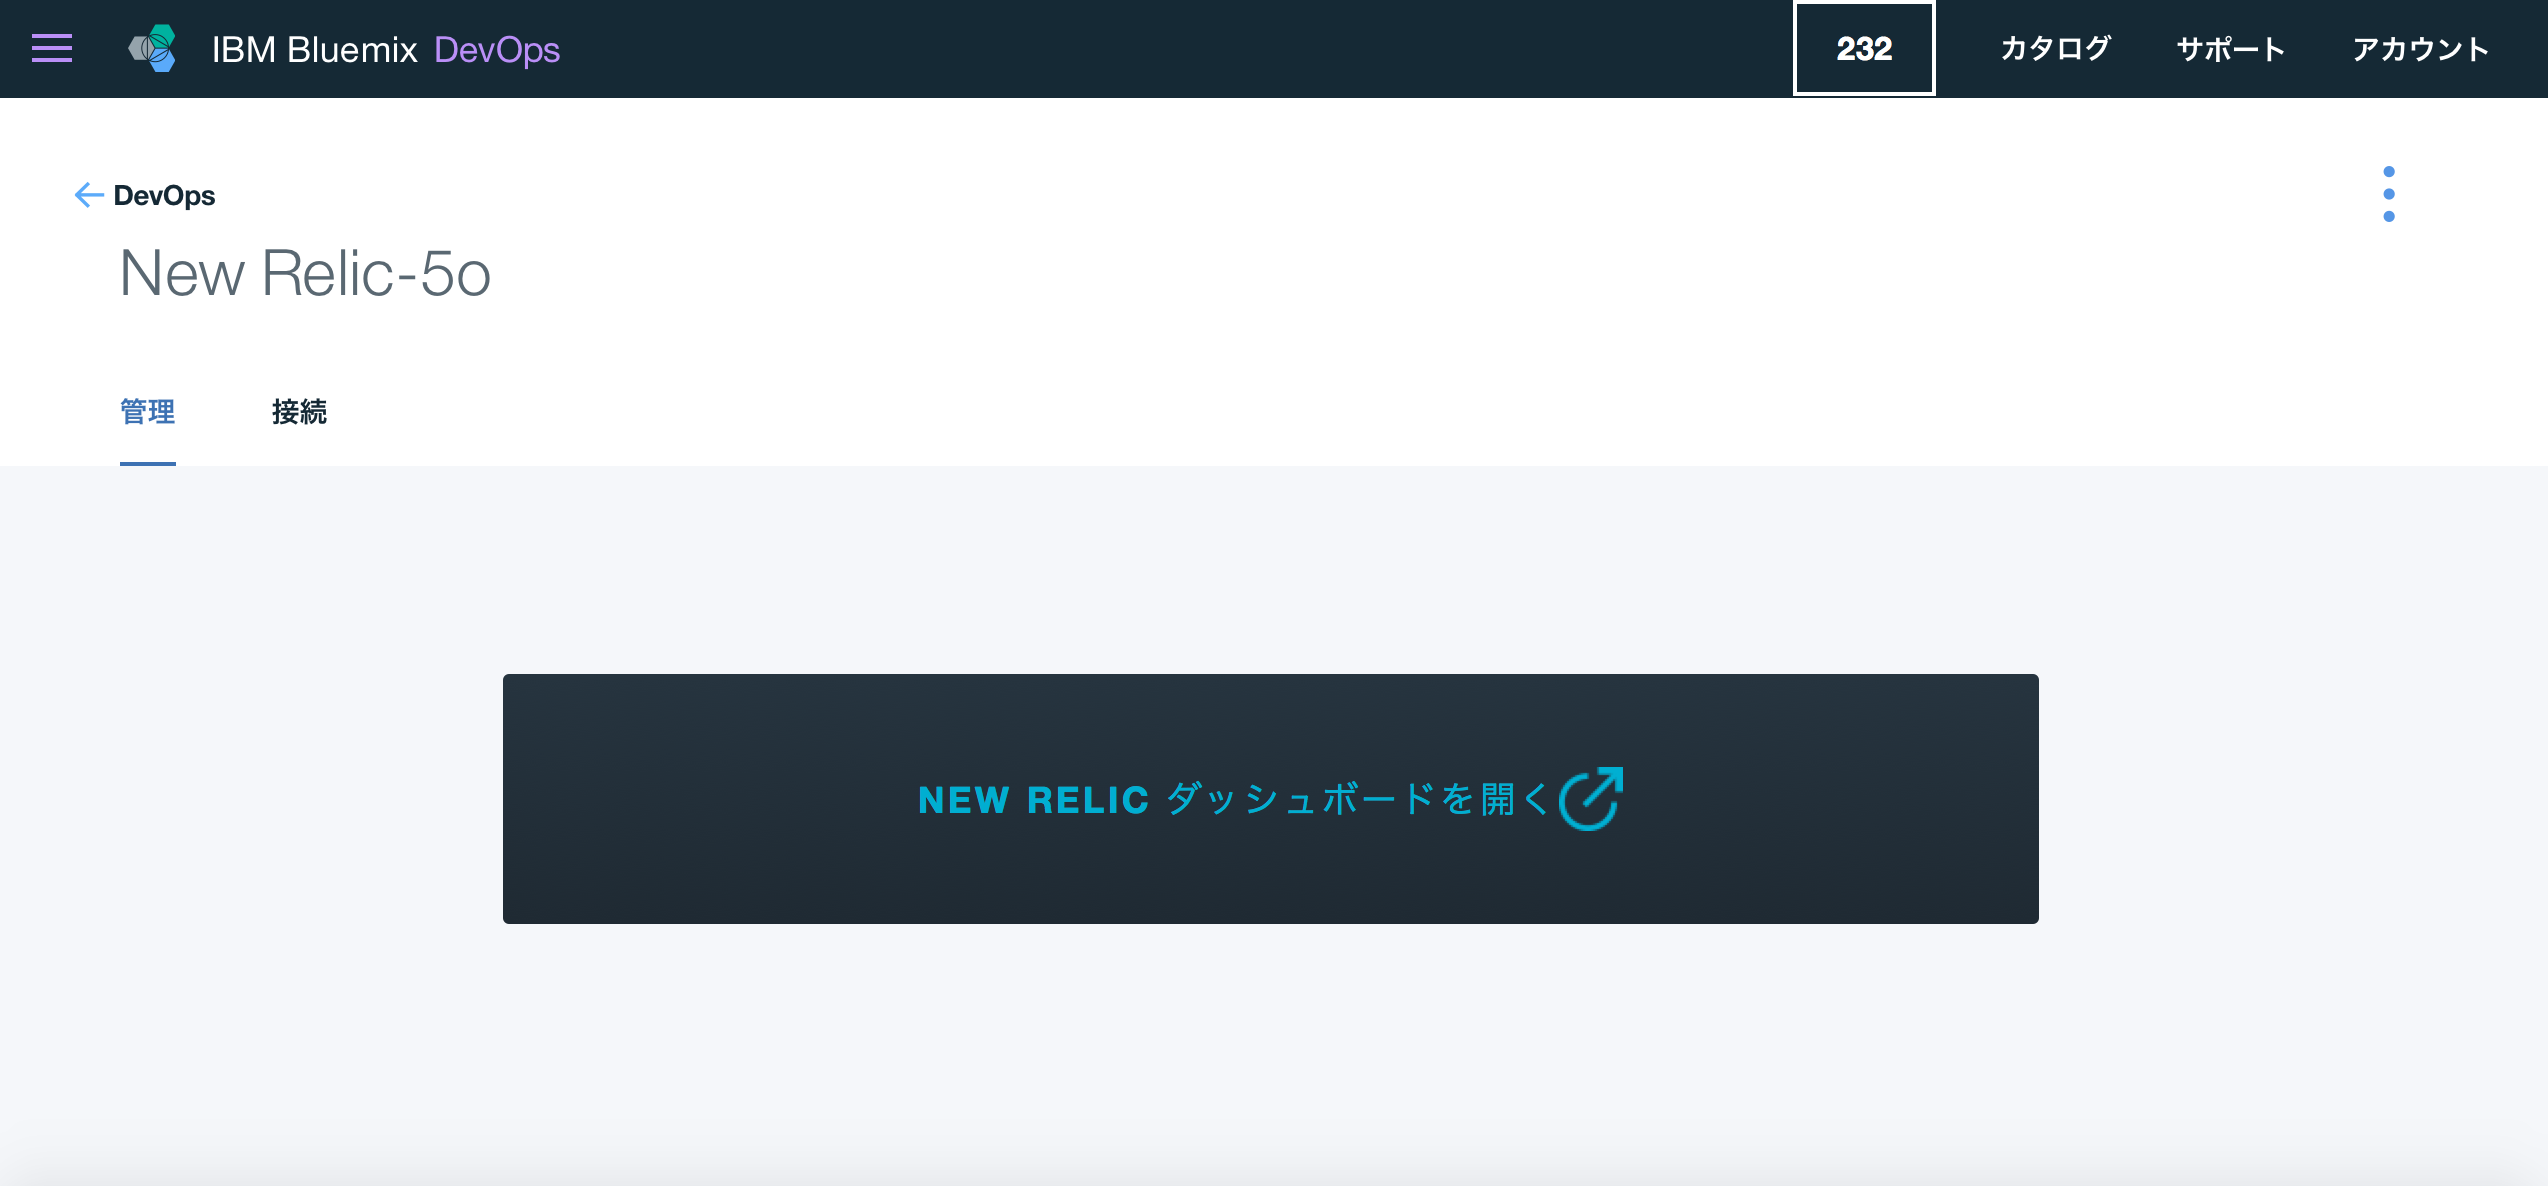
セットアップ完了!
これでBluemix側での作業は完了です。
New Relicダッシュボードの確認
ブラウザ上にNew Relicダッシュボードが表示されます。
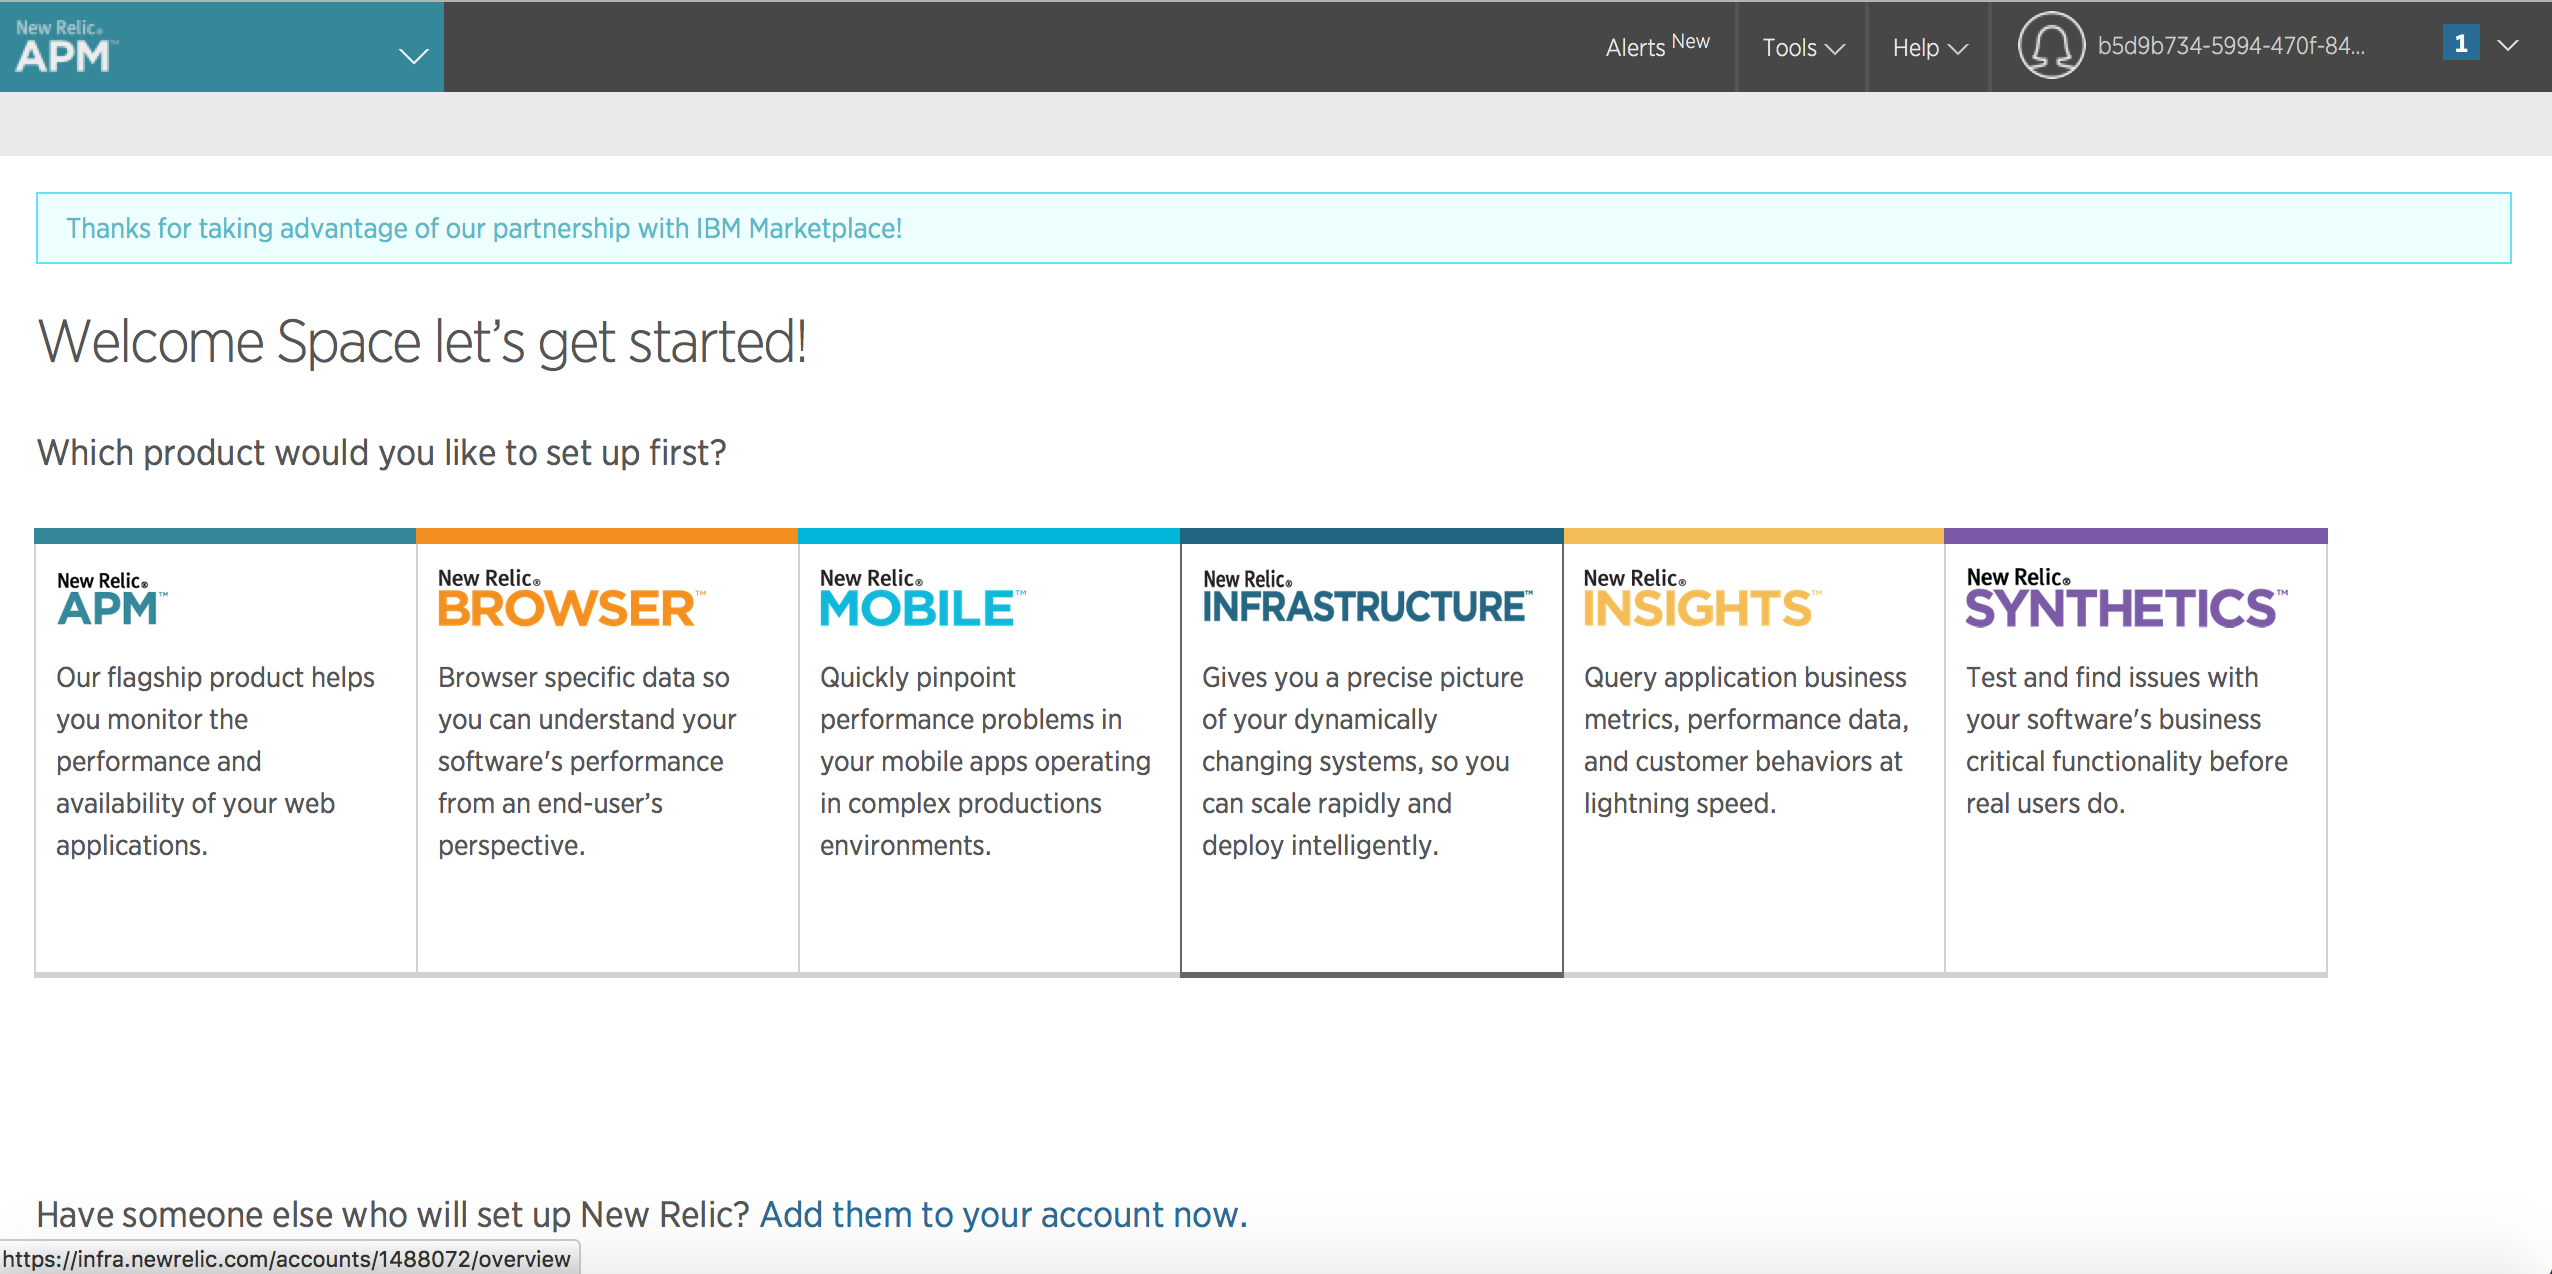
New Relic Infrastructureの表示
今回は仮想サーバーを監視したいので、Browserメニューより、Infrastructureをクリックします。Windows、Linuxそれぞれのエージェントのインストール手順が記載されています。

監視対象サーバーにエージェントをインストール
ダッシュボードに記載されている手順にしたがい、監視対象サーバー(今回はBluemix Infrastructureの仮想サーバー)にエージェントをインストールします。
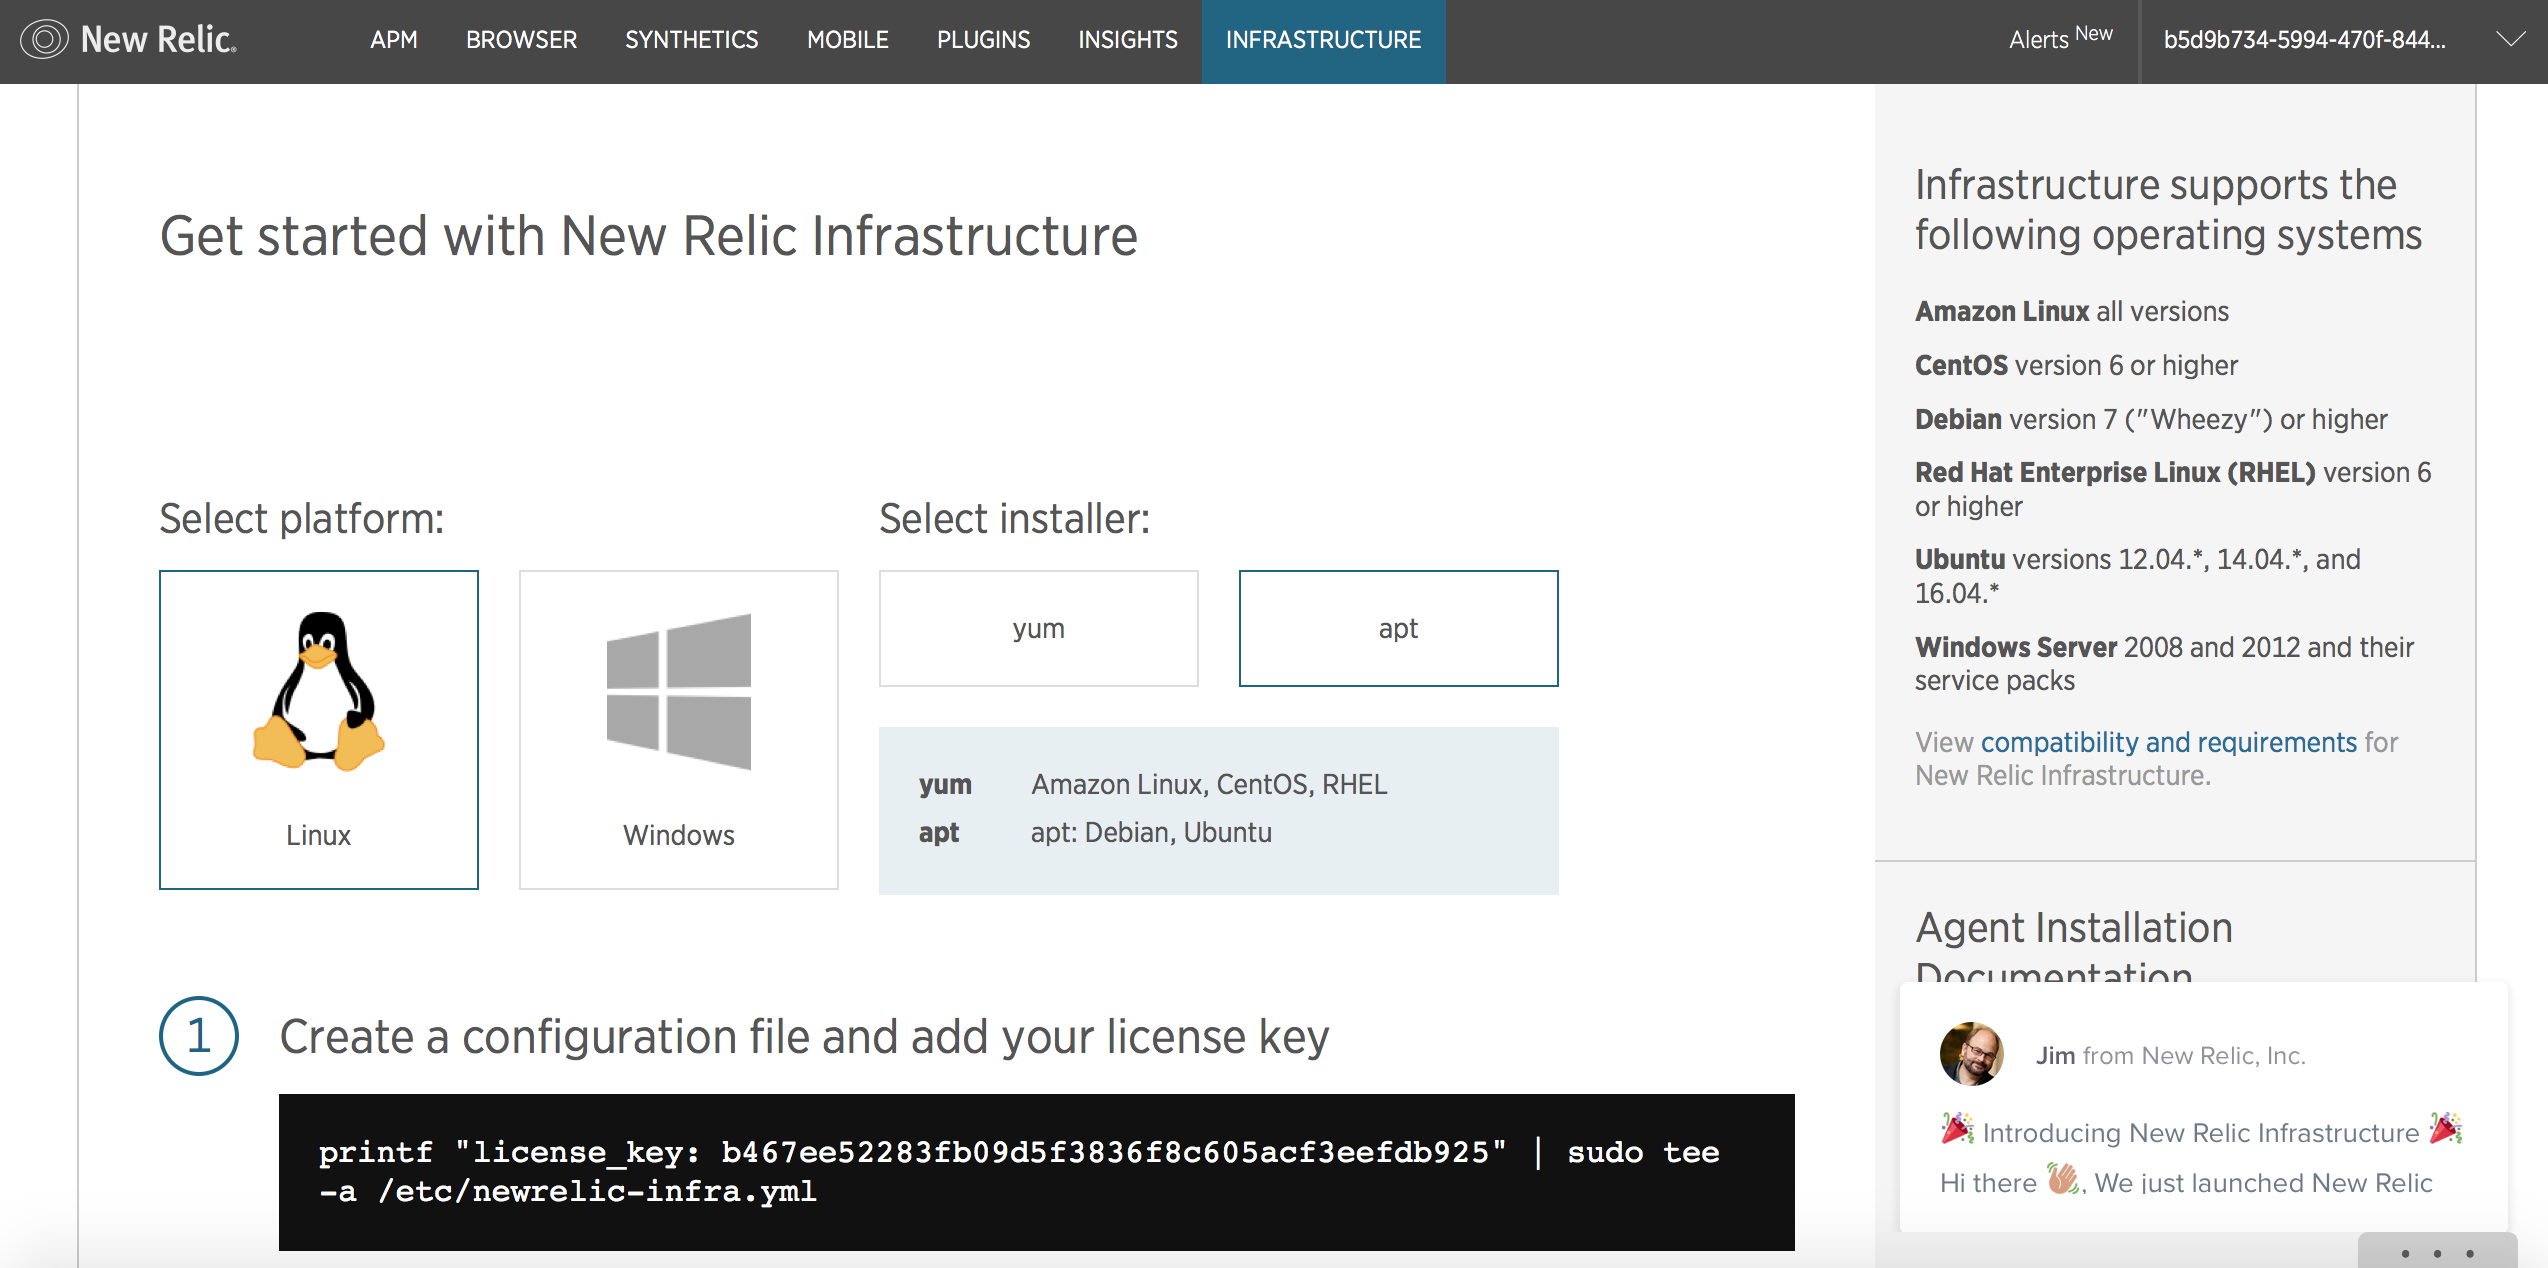
ライセンス・キーの追加
構成用ファイルを作成し、ライセンス・キーを追加します。
# printf "license_key: b467ee52283fb09d5f3836f8c605acf3eefdb925" | sudo tee -a /etc/newrelic-infra.yml
license_key: b467ee52283fb09d5f3836f8c605acf3eefdb925
New RelicのGPGキーの有効化
まずは、ライセンス・キーを有効化します。
# curl https://download.newrelic.com/infrastructure_agent/gpg/newrelic-infra.gpg | sudo apt-key add -
  % Total    % Received % Xferd  Average Speed   Time    Time     Time  Current
                                 Dload  Upload   Total   Spent    Left  Speed
100  1662  100  1662    0     0   1386      0  0:00:01  0:00:01 --:--:--  1387
OK
エージェントのaptレポジトリーの作成
debパッケージをリポジトリーに追加します。
# printf "deb http://download.newrelic.com/infrastructure_agent/linux/apt xenial main" | sudo tee -a /etc/apt/sources.list.d/newrelic-infra.list
deb http://download.newrelic.com/infrastructure_agent/linux/apt xenial main
aptキャッシュのアップデート
apt-get updateコマンドによりaptキャッシュをアップデートします。
# sudo apt-get update
Hit:1 http://mirrors.service.networklayer.com/ubuntu xenial InRelease
Hit:2 http://mirrors.service.networklayer.com/ubuntu xenial-updates InRelease
Hit:3 http://mirrors.service.networklayer.com/ubuntu xenial-backports InRelease
Hit:4 http://mirrors.service.networklayer.com/ubuntu xenial-security InRelease
Get:5 http://download.newrelic.com/infrastructure_agent/linux/apt xenial InRelease [3,156 B]
Get:6 http://download.newrelic.com/infrastructure_agent/linux/apt xenial/main amd64 Packages [534 B]
Fetched 3,690 B in 1s (3,094 B/s)
Reading package lists... Done
エージェントのインストール
apt-getコマンドでNew Reric Infrastructureのエージェントをインストールします。
# sudo apt-get install newrelic-infra -y
Reading package lists... Done
Building dependency tree
Reading state information... Done
The following NEW packages will be installed:
  newrelic-infra
0 upgraded, 1 newly installed, 0 to remove and 37 not upgraded.
Need to get 14.4 MB of archives.
After this operation, 43.6 MB of additional disk space will be used.
Get:1 http://download.newrelic.com/infrastructure_agent/linux/apt xenial/main amd64 newrelic-infra amd64 1.0.292 [14.4 MB]
Fetched 14.4 MB in 6s (2,100 kB/s)
Selecting previously unselected package newrelic-infra.
(Reading database ... 53670 files and directories currently installed.)
Preparing to unpack .../newrelic-infra_1.0.292_amd64.deb ...
Unpacking newrelic-infra (1.0.292) ...
Setting up newrelic-infra (1.0.292) ...
Created symlink from /etc/systemd/system/multi-user.target.wants/newrelic-infra.service to /etc/systemd/system/newrelic-infra.service.
エージェントのステータス確認コマンド
# sudo systemctl status newrelic-infra
● newrelic-infra.service - New Relic Infrastructure Agent
   Loaded: loaded (/etc/systemd/system/newrelic-infra.service; enabled; vendor preset: enabled)
   Active: active (running) since Fri 2016-11-25 04:06:57 UTC; 23min ago
 Main PID: 789 (newrelic-infra)
    Tasks: 18
   Memory: 25.3M (limit: 1.0G)
      CPU: 37.267s
   CGroup: /system.slice/newrelic-infra.service
           └─789 /usr/bin/newrelic-infra

Nov 25 04:06:57 asasaki.ibmcloud.com newrelic-infra[789]: time="2016-11-25T04:06:57Z" level=warning ms
Nov 25 04:06:57 asasaki.ibmcloud.com newrelic-infra[789]: time="2016-11-25T04:06:57Z" level=warning ms
Nov 25 04:06:57 asasaki.ibmcloud.com newrelic-infra[789]: time="2016-11-25T04:06:57Z" level=error msg=
Nov 25 04:06:57 asasaki.ibmcloud.com newrelic-infra[789]: time="2016-11-25T04:06:57Z" level=error msg=
Nov 25 04:06:57 asasaki.ibmcloud.com newrelic-infra[789]: time="2016-11-25T04:06:57Z" level=error msg=
Nov 25 04:06:57 asasaki.ibmcloud.com newrelic-infra[789]: time="2016-11-25T04:06:57Z" level=error msg=
Nov 25 04:06:57 asasaki.ibmcloud.com newrelic-infra[789]: time="2016-11-25T04:06:57Z" level=error msg=
Nov 25 04:06:57 asasaki.ibmcloud.com newrelic-infra[789]: time="2016-11-25T04:06:57Z" level=error msg=
Nov 25 04:06:57 asasaki.ibmcloud.com newrelic-infra[789]: time="2016-11-25T04:06:57Z" level=error msg=
Nov 25 04:06:57 asasaki.ibmcloud.com newrelic-infra[789]: time="2016-11-25T04:06:57Z" level=error msg=
lines 1-20/20 (END)
監視テスト
ダッシュボードの確認
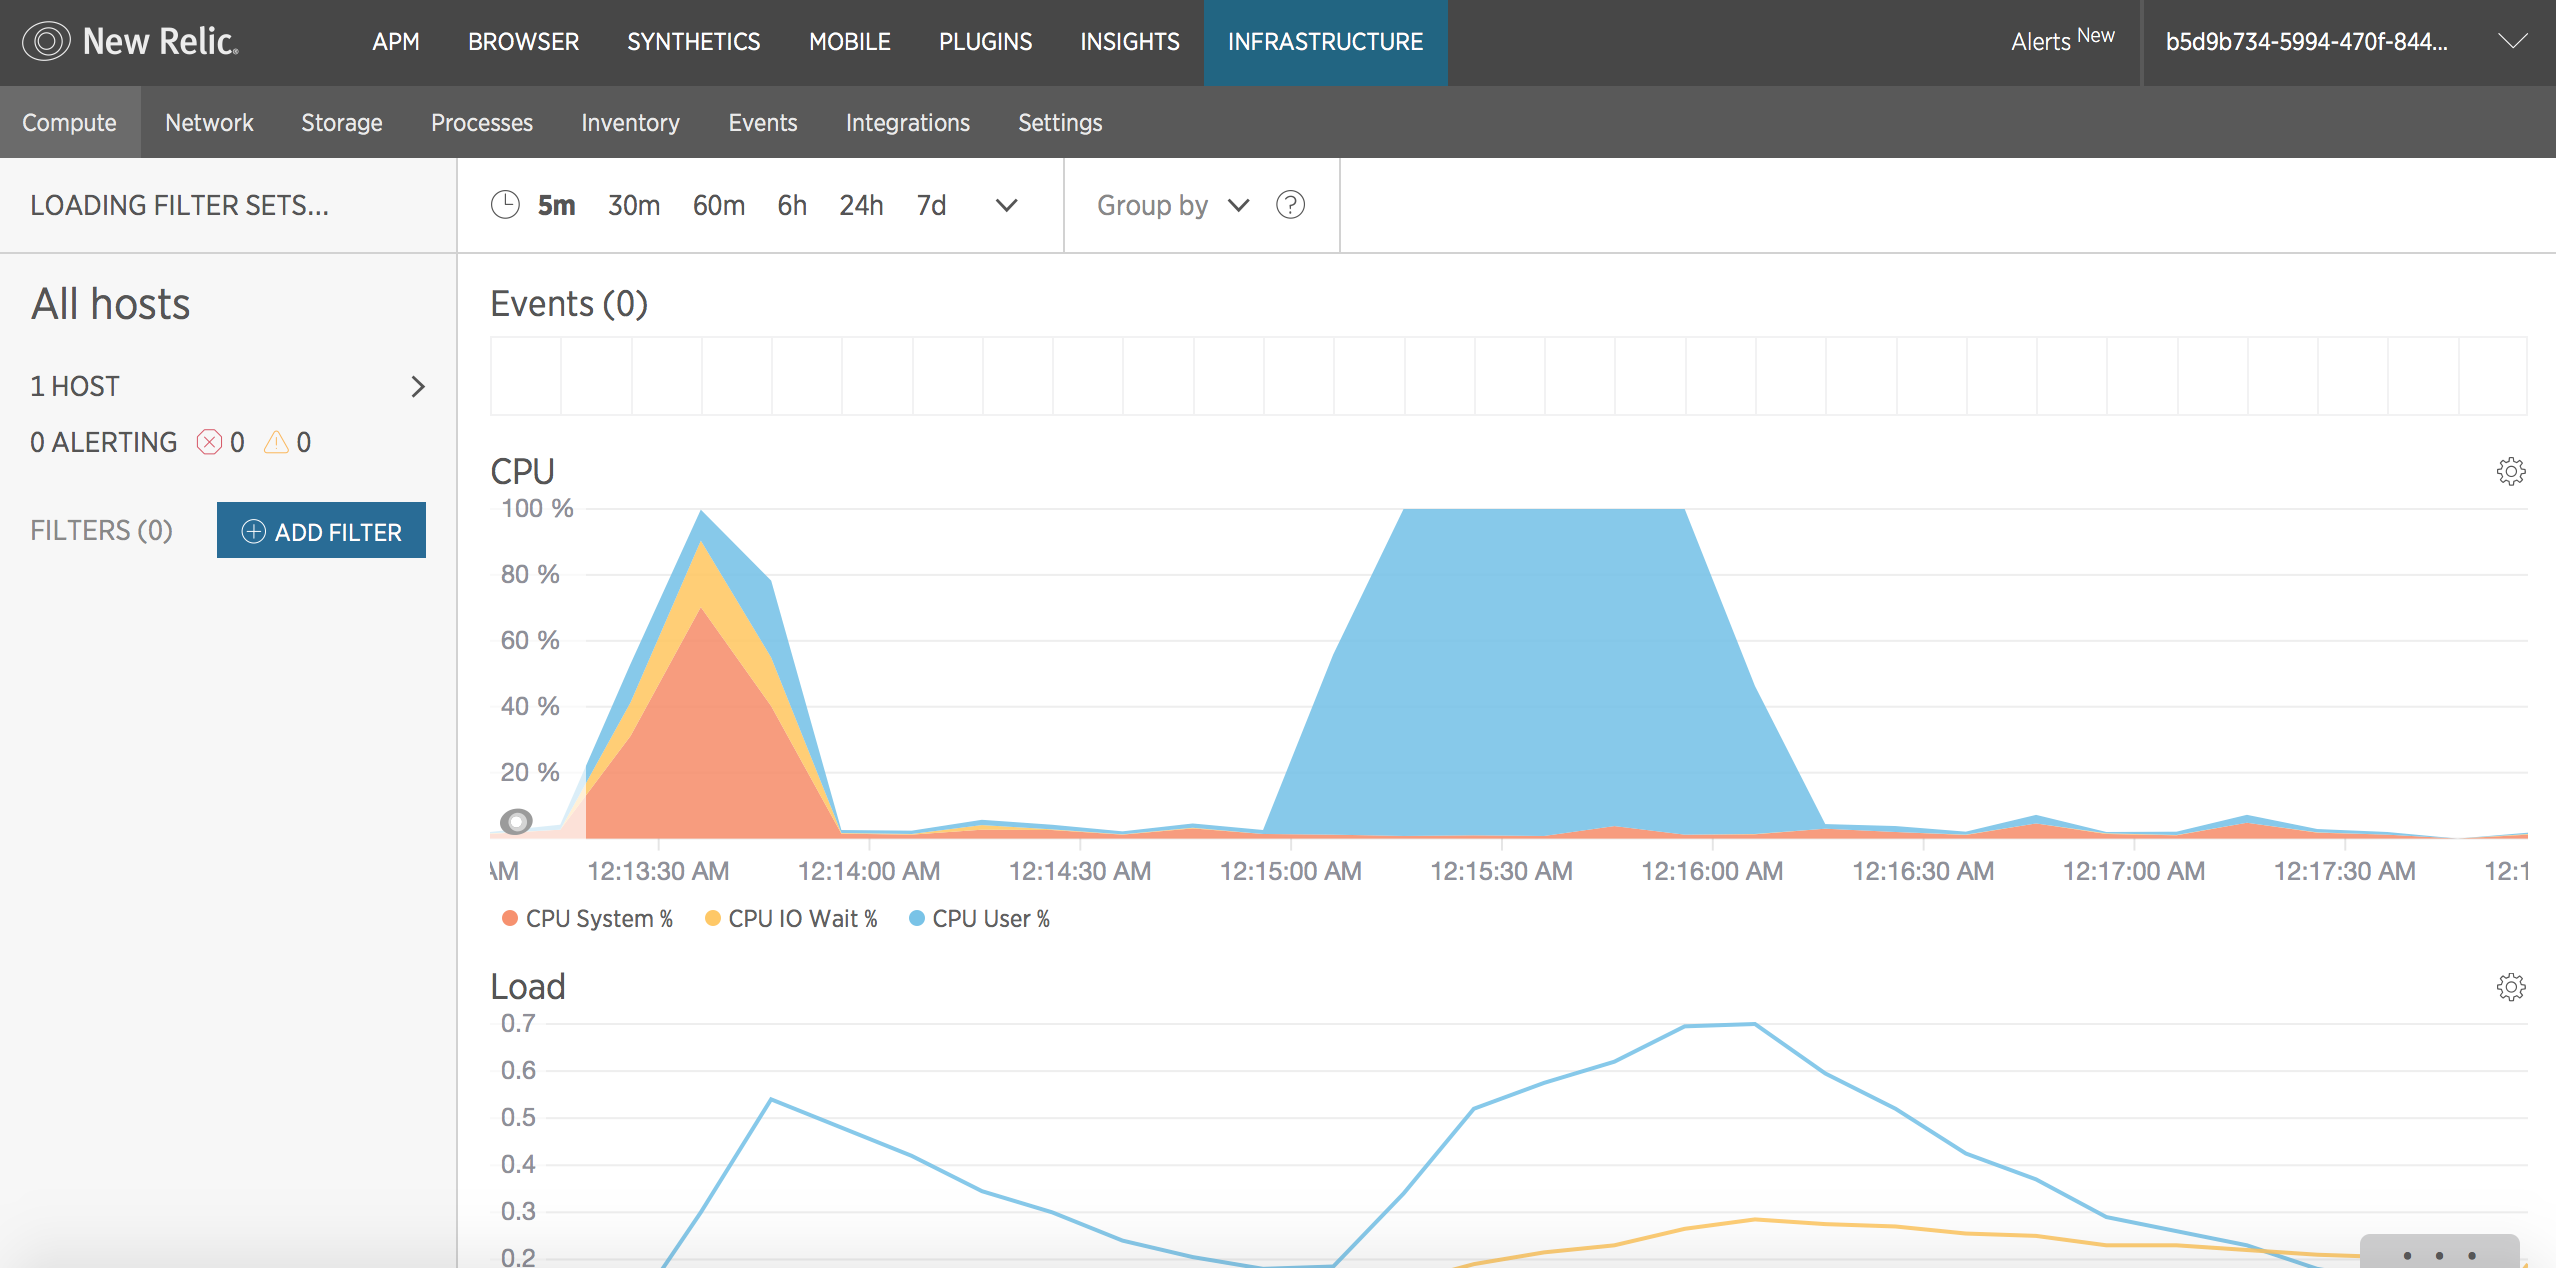
エージェントをインストールしてしばらくすると自動的に監視サーバーにモニタリング情報が自動送信されます。ダッシュボードに監視情報が表示されていることを確認します。かなりさくさく動きます!!
負荷ツールのインストール
監視対象サーバーにstressツール(負荷ツール)をインストールして負荷テストをします。
# sudo apt-get install stress
Reading package lists... Done
Building dependency tree
Reading state information... Done
The following NEW packages will be installed:
  stress
0 upgraded, 1 newly installed, 0 to remove and 37 not upgraded.
Need to get 16.7 kB of archives.
After this operation, 75.8 kB of additional disk space will be used.
Get:1 http://mirrors.service.networklayer.com/ubuntu xenial/universe amd64 stress amd64 1.0.4-1 [16.7 kB]
Fetched 16.7 kB in 0s (774 kB/s)
Selecting previously unselected package stress.
(Reading database ... 53702 files and directories currently installed.)
Preparing to unpack .../stress_1.0.4-1_amd64.deb ...
Unpacking stress (1.0.4-1) ...
Processing triggers for man-db (2.7.5-1) ...
Processing triggers for install-info (6.1.0.dfsg.1-5) ...
Setting up stress (1.0.4-1) ...
負荷テスト
CPUに対して1分間負荷をかけます。
# stress --cpu 1 --timeout 60s
stress: info: [13967] dispatching hogs: 1 cpu, 0 io, 0 vm, 0 hdd
stress: info: [13967] successful run completed in 60s
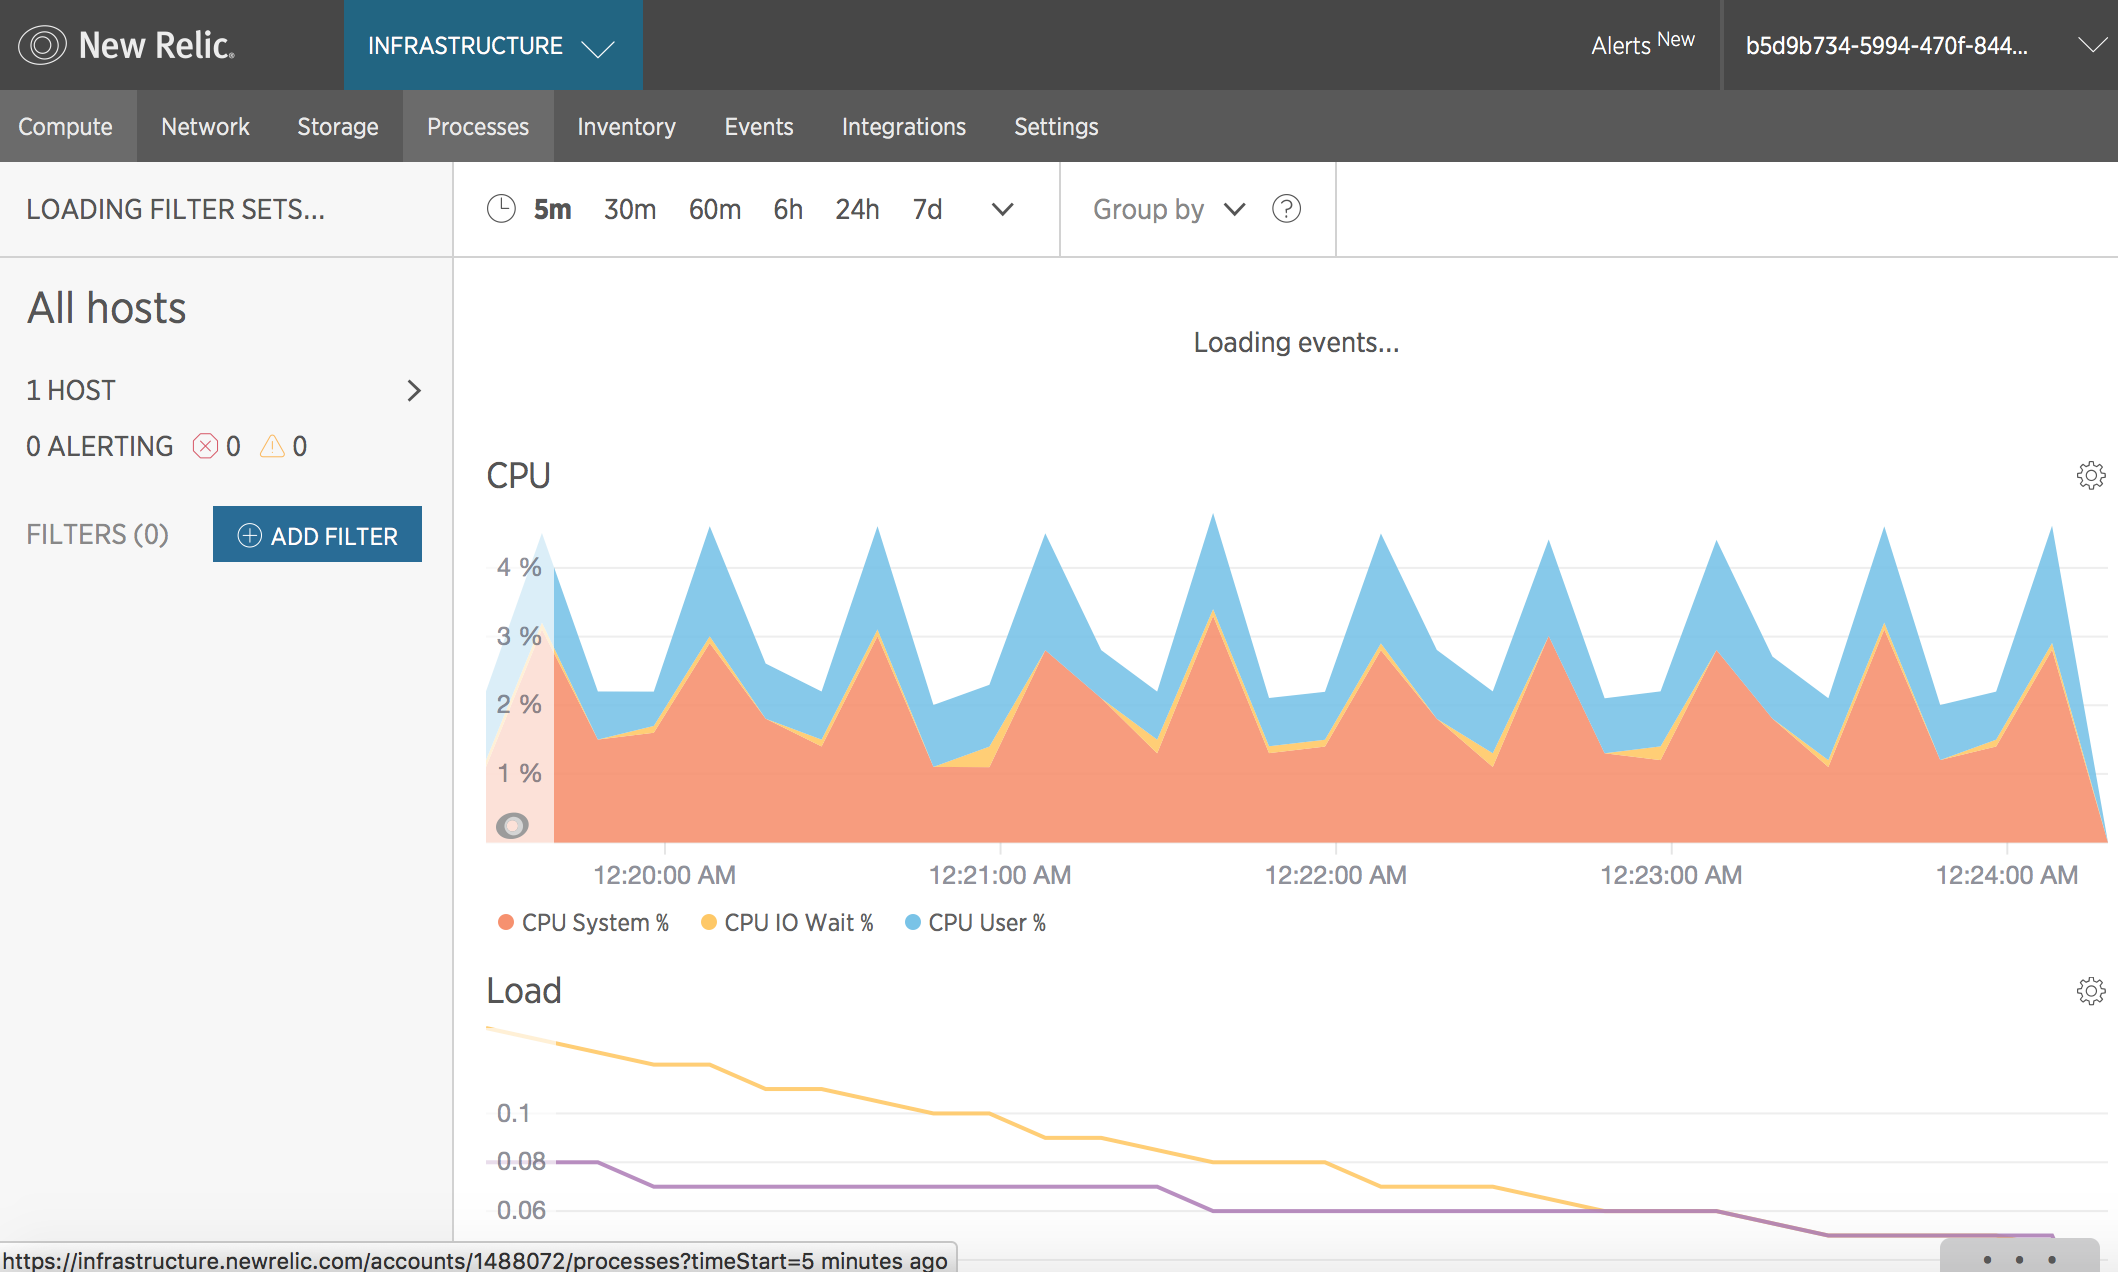
該当時間にダッシュボード上でCPU負荷がかかっていることが分かります。
New Relic Infrastructureの監視項目一覧
監視項目別にNew Relic Infrastructureの監視画面を見てみます。
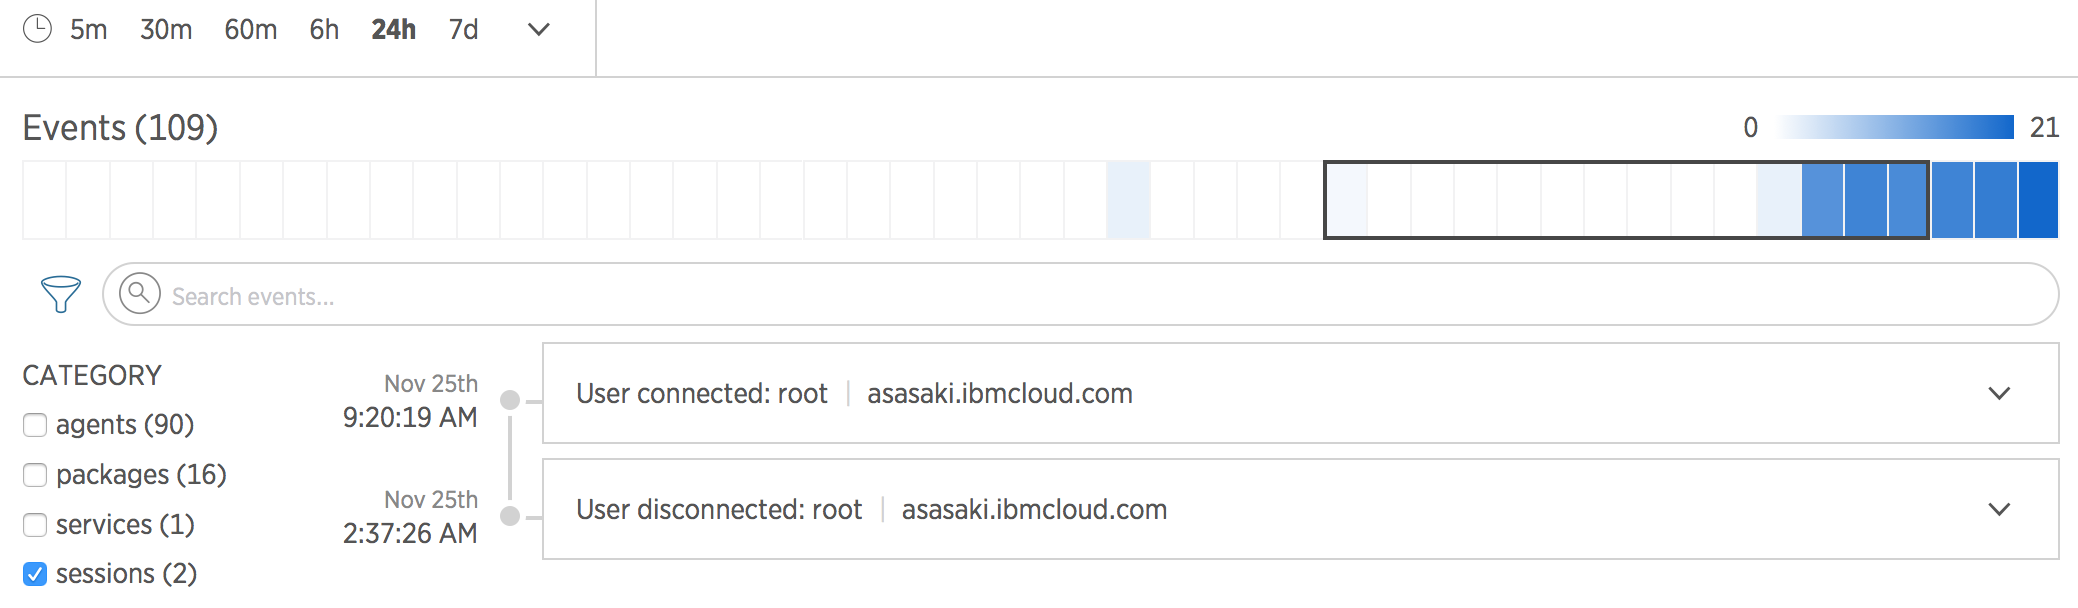
イベント
対象サーバーで過去に実行されたイベント(エージェント、パッケージ、サービス、セッション)を監視することができます。
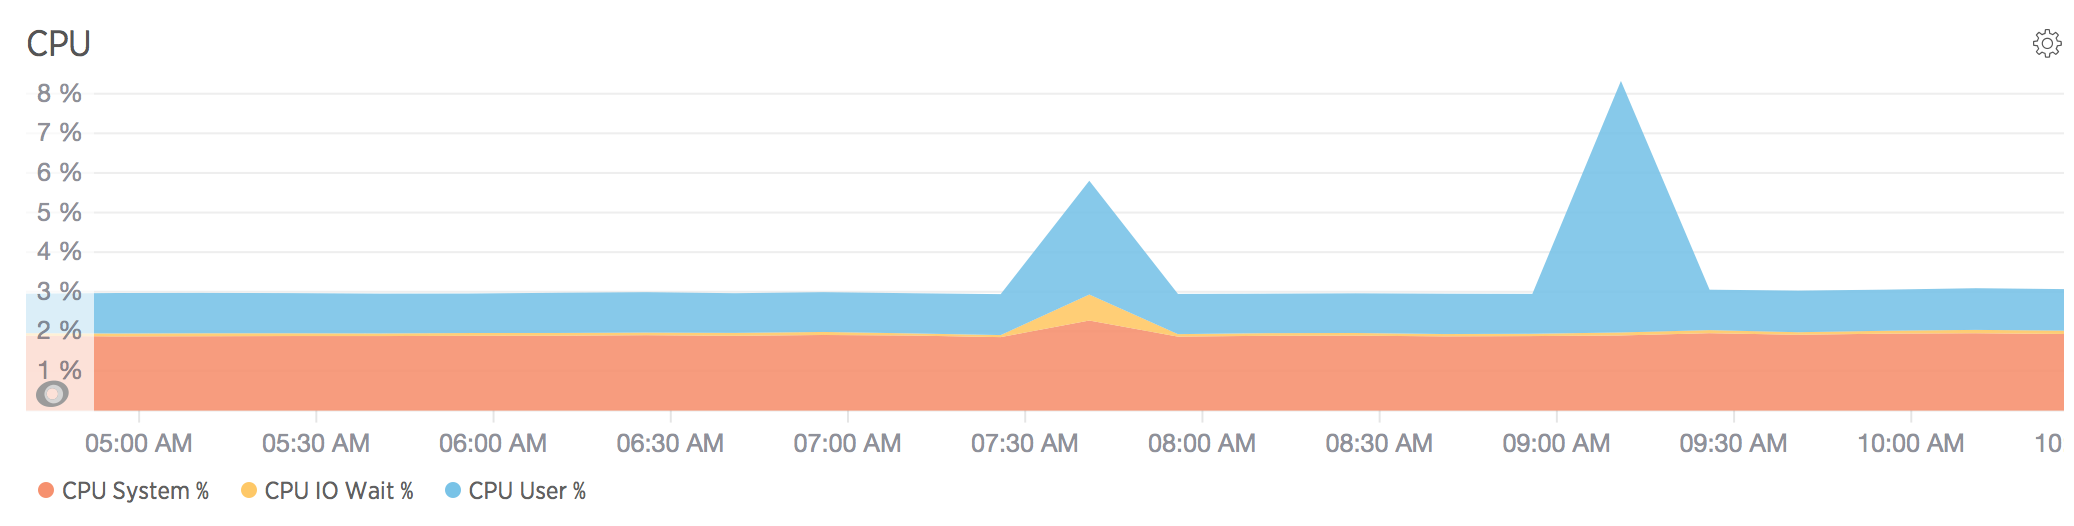
CPU監視
"CPU System"、"CPU IO Wait"、"CPU User"を監視することができます。
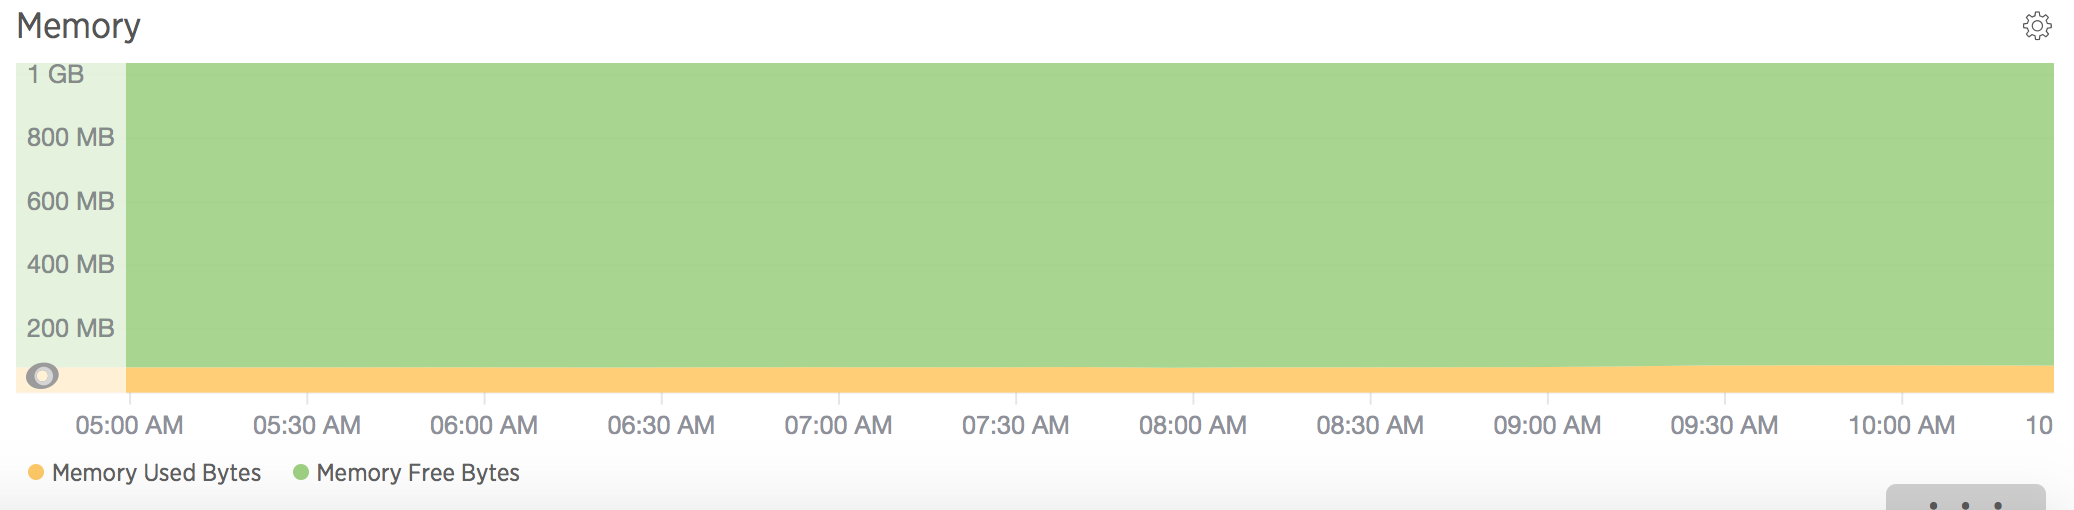
メモリ監視
"Memory Used"、"Memory Free"を監視することができます。
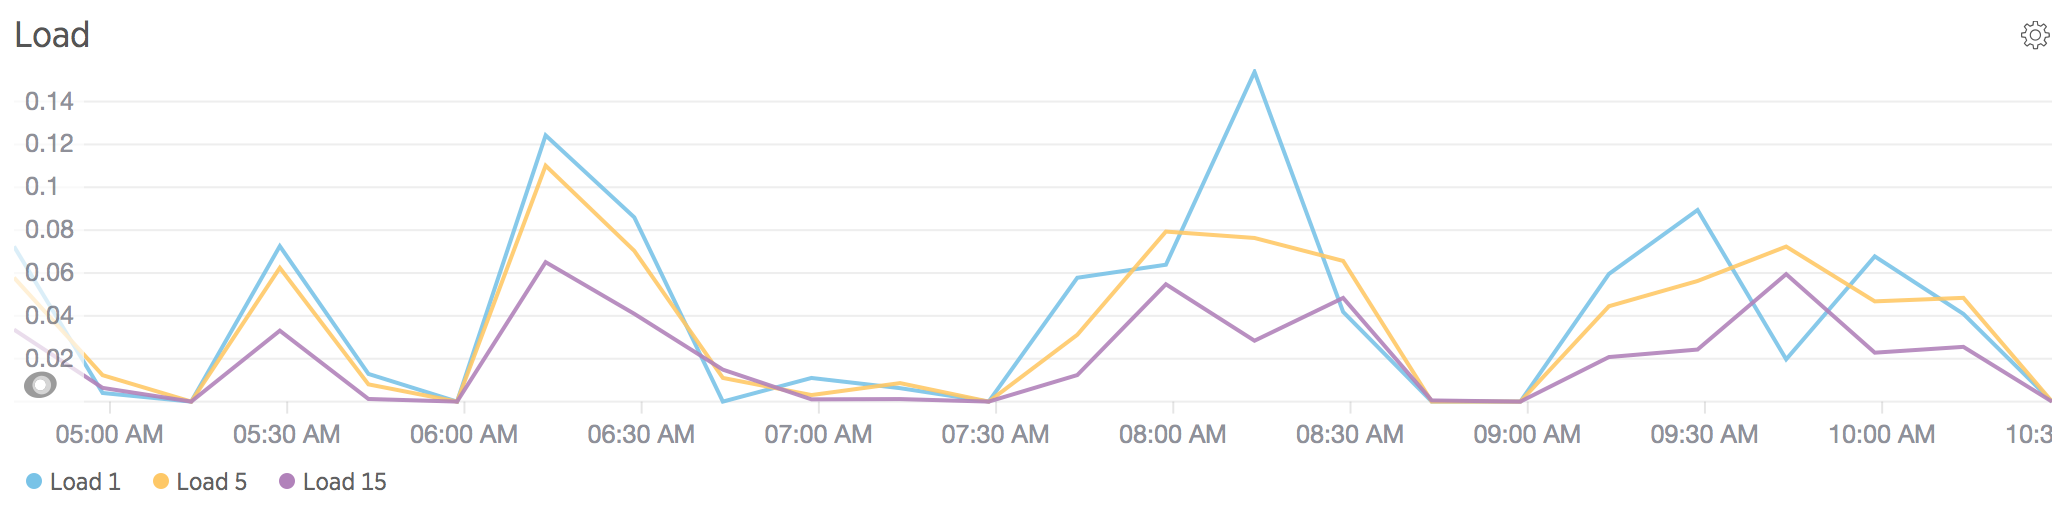
ロード
ロード・アベレージ(単位時間あたりの平均的な負荷)も監視できるようです。
New Relic SYNTHETICS
次にNew Relic SYNTHETICSを使った死活監視(Ping監視)を設定します。
New Relic SYNTHETICSをクリック

新規モニター作成

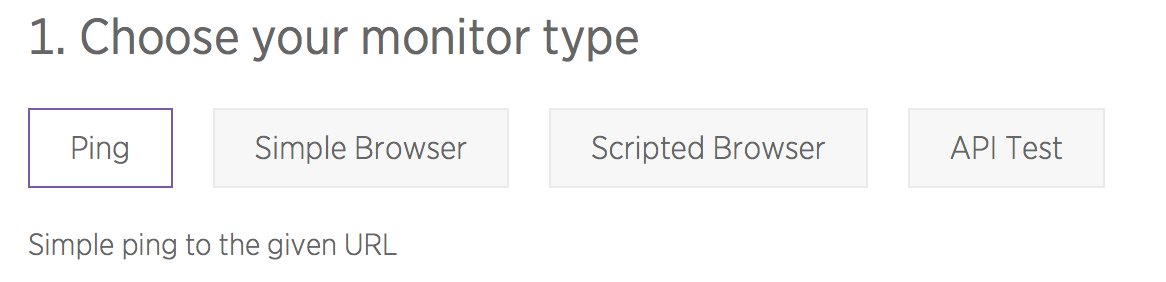
モニター・タイプの選択
監視対象URLの入力
監視対象を設定します。
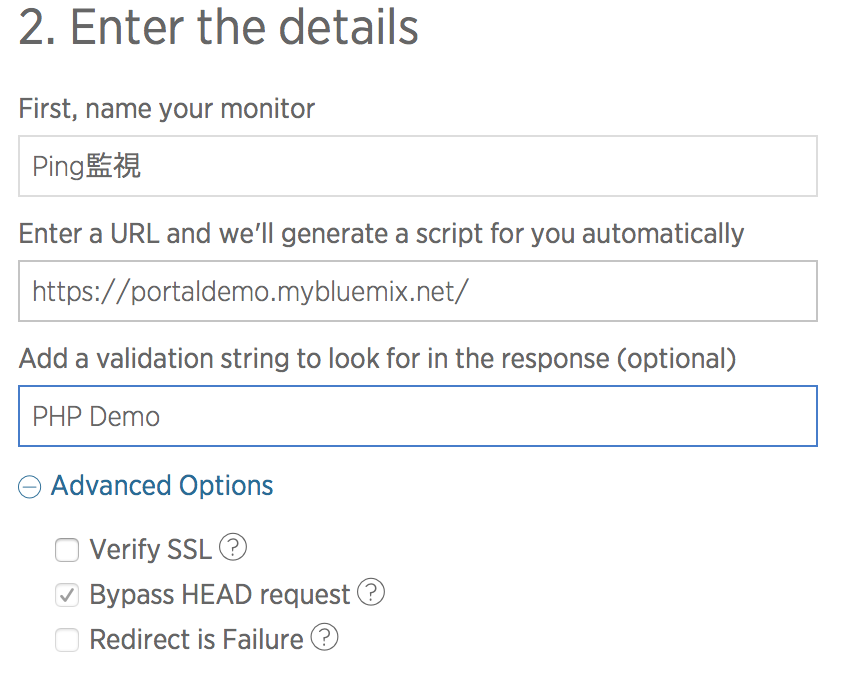
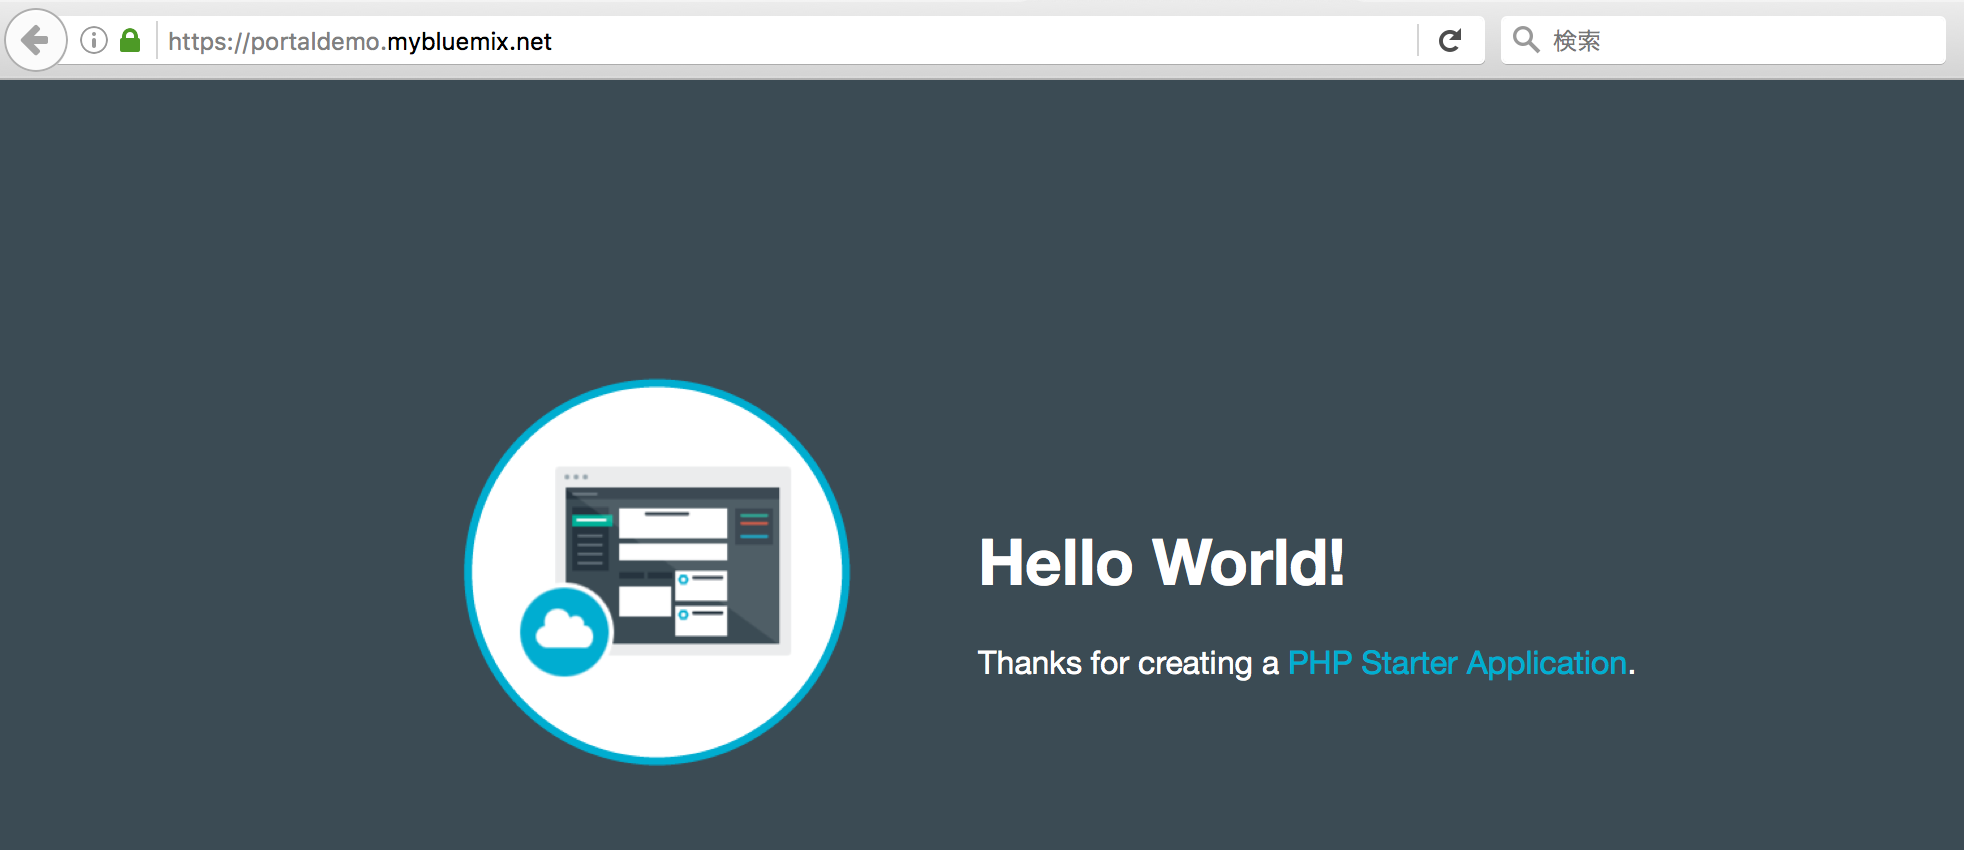
ここでは監視対象として、Bluemix上に起ち上げたPHPランタイムを設定しました。 PHPランタイムのURL (https://portaldemo.mybluemix.net/)を入力しました。
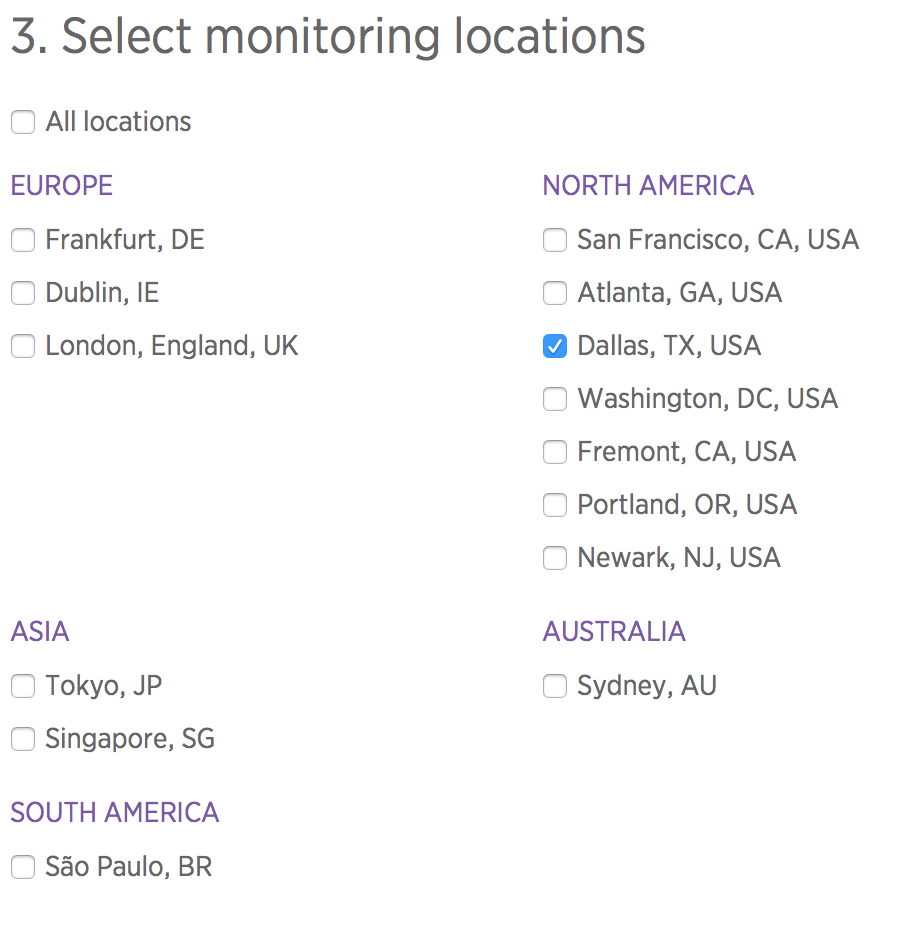
監視対象のロケーションを選択します。ここでは、ダラスを選択しています。
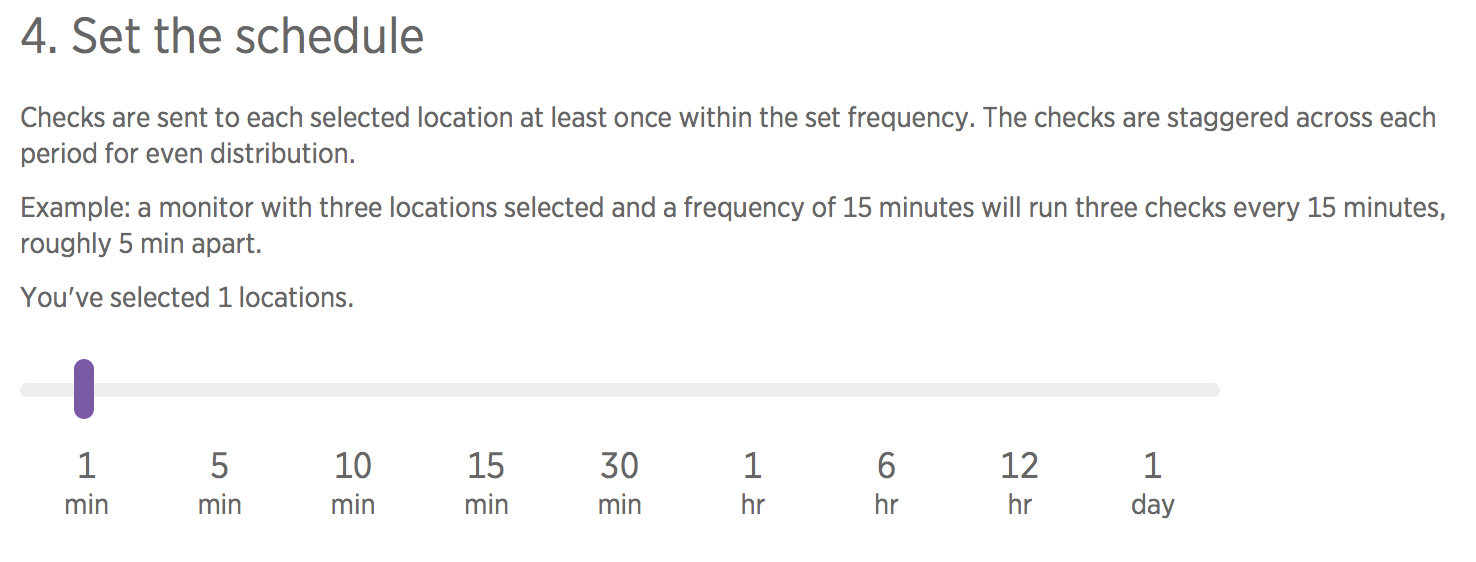
ポーリング間隔を設定します。ここでは、1分おきに設定しました。
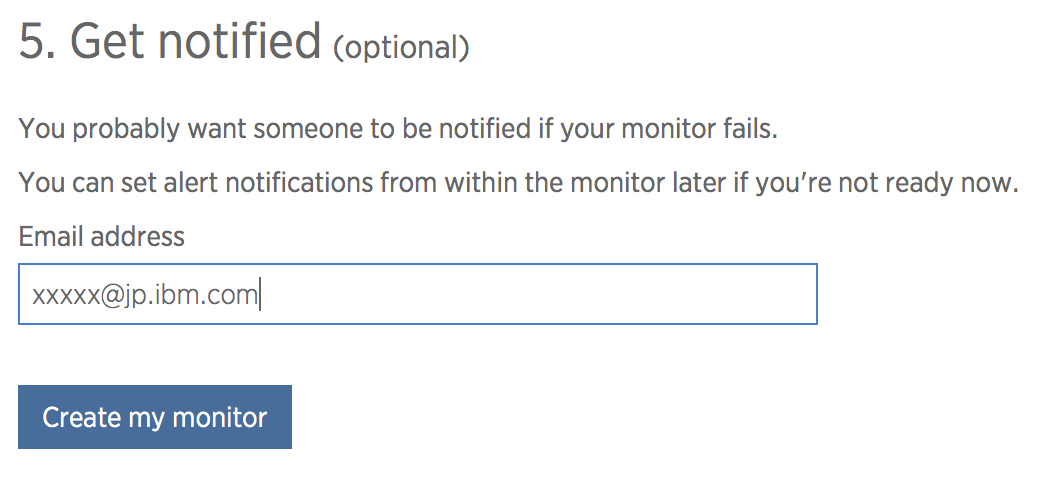
最後にアラート通知先のメール・アドレスを設定し"Create my monitor"ボタンをクリックすれば完了です。
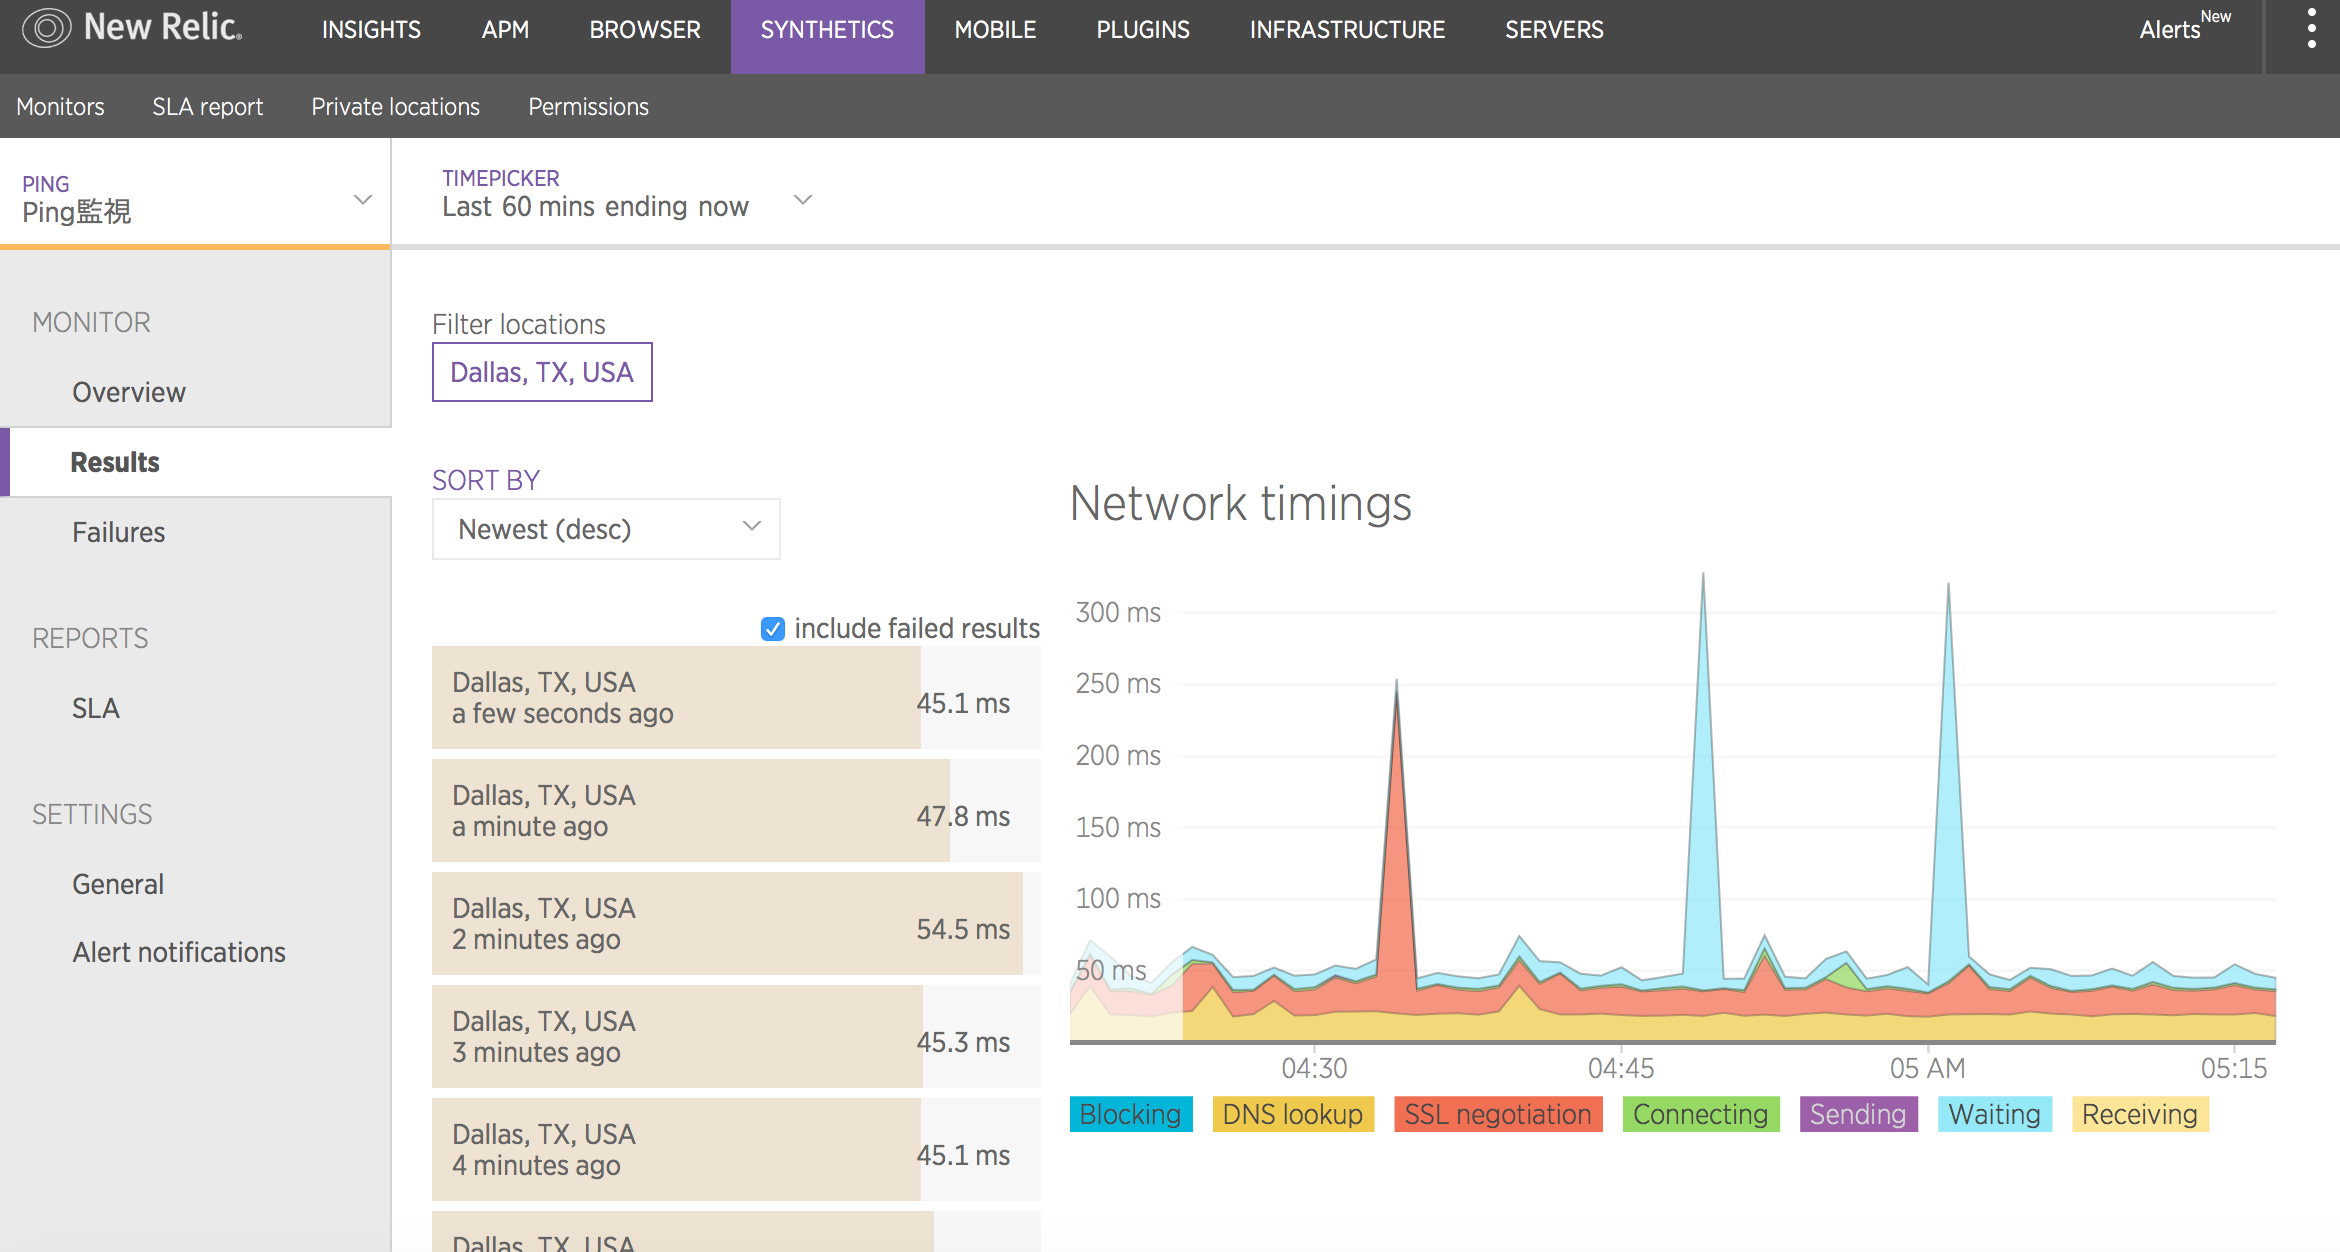
モニタリング結果
5分くらい待つとモニタリング結果がダッシュボード上に表示されます。
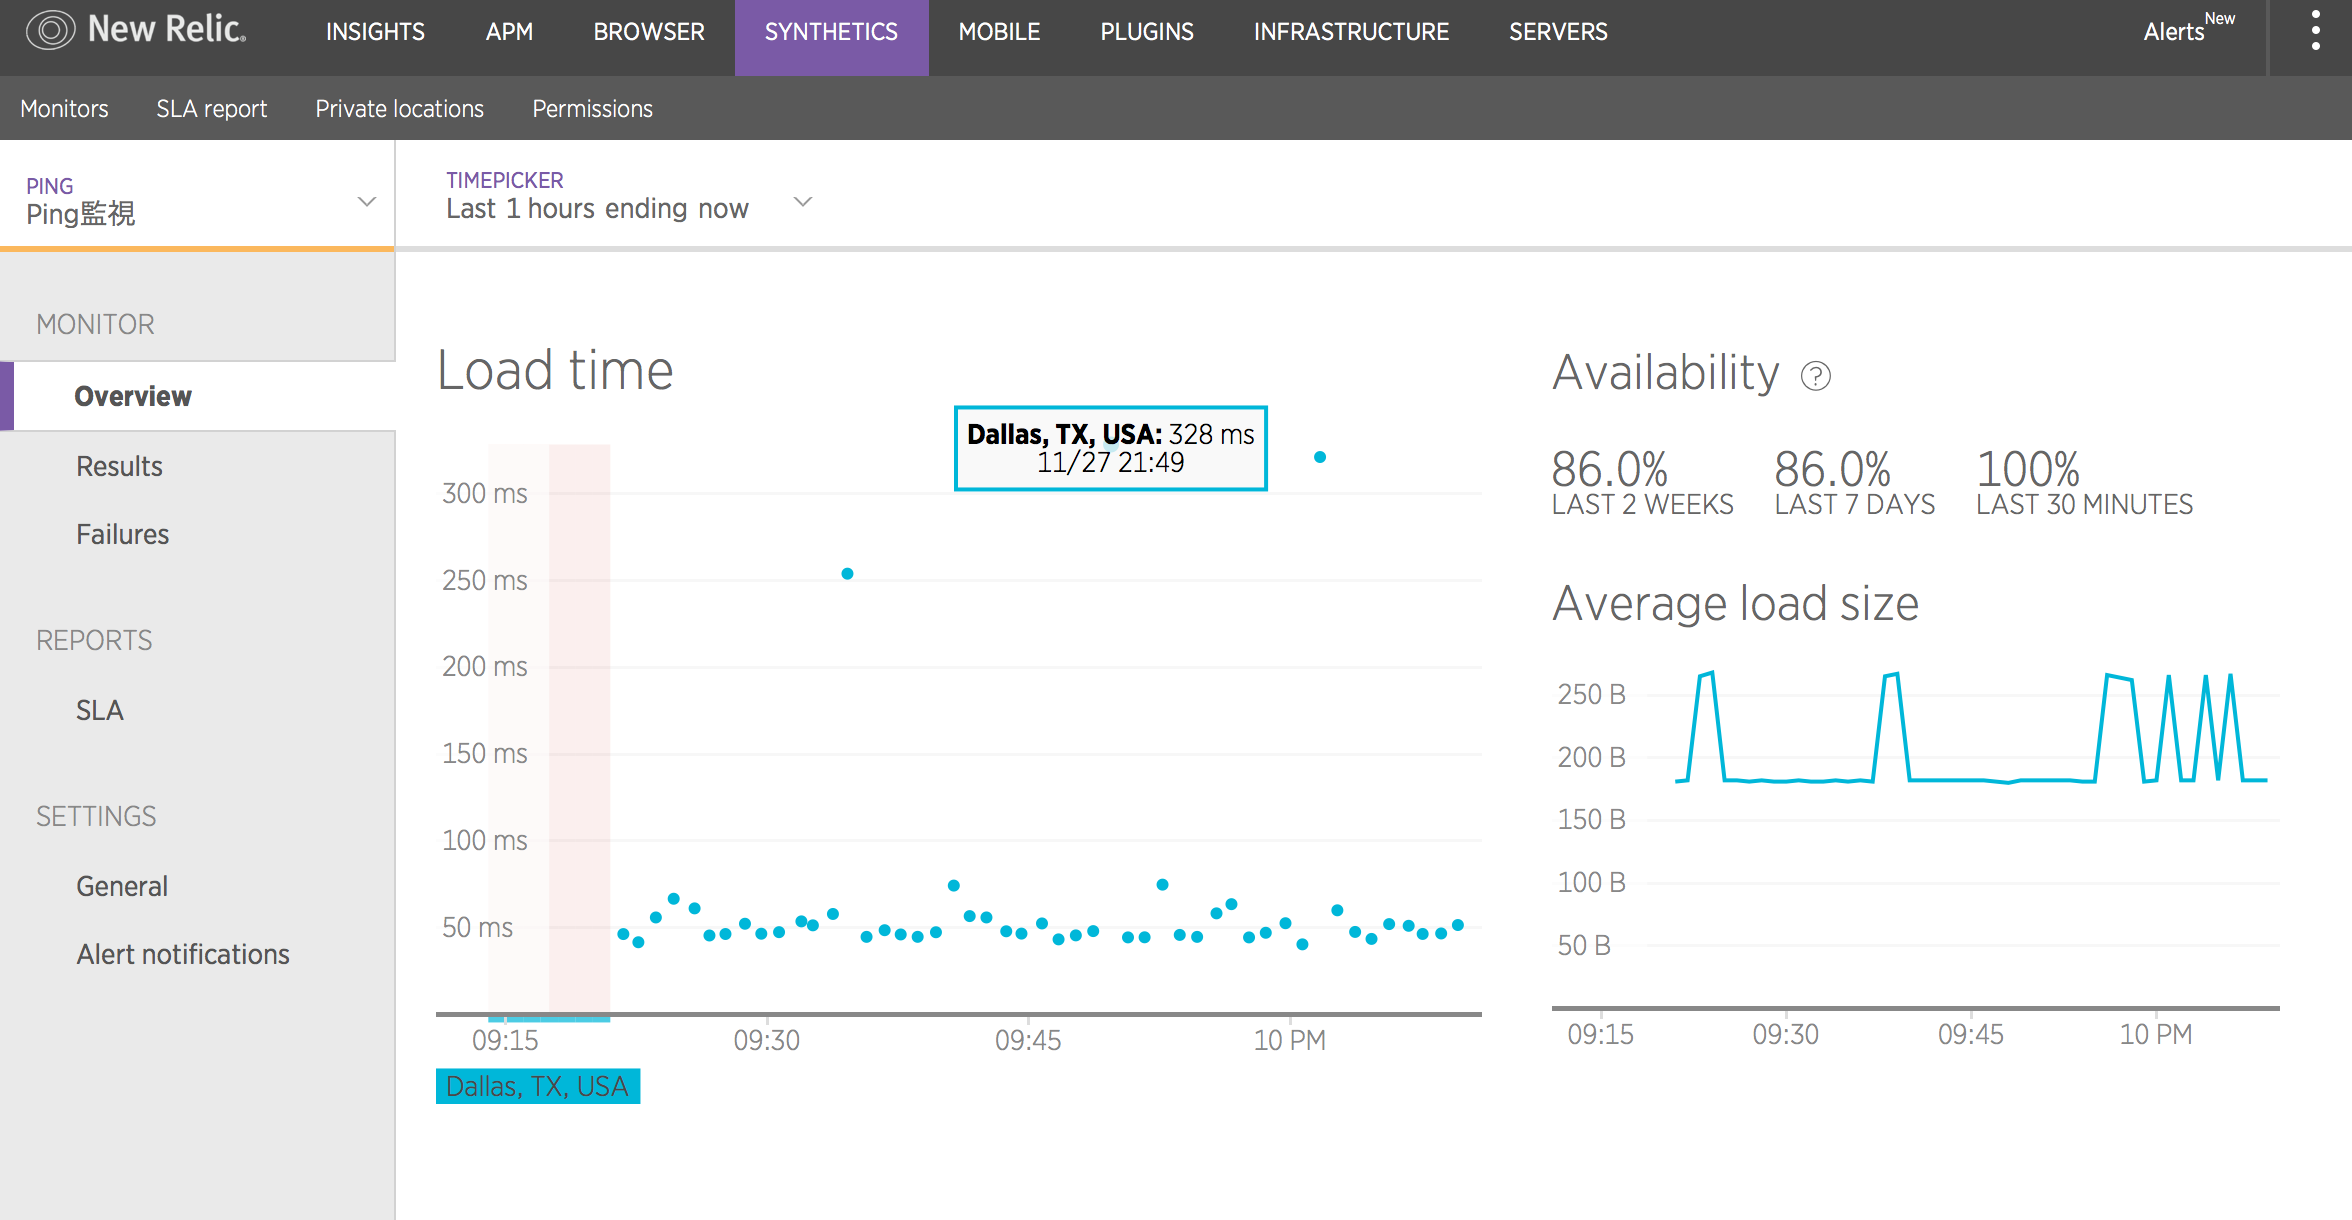
Blocking、DNS lookup、SSL Negotiation、Connecting、Sending、Waiting、Receivingなど様々なネットワーク・アクセスのパフォーマンスがモニタリングされています。
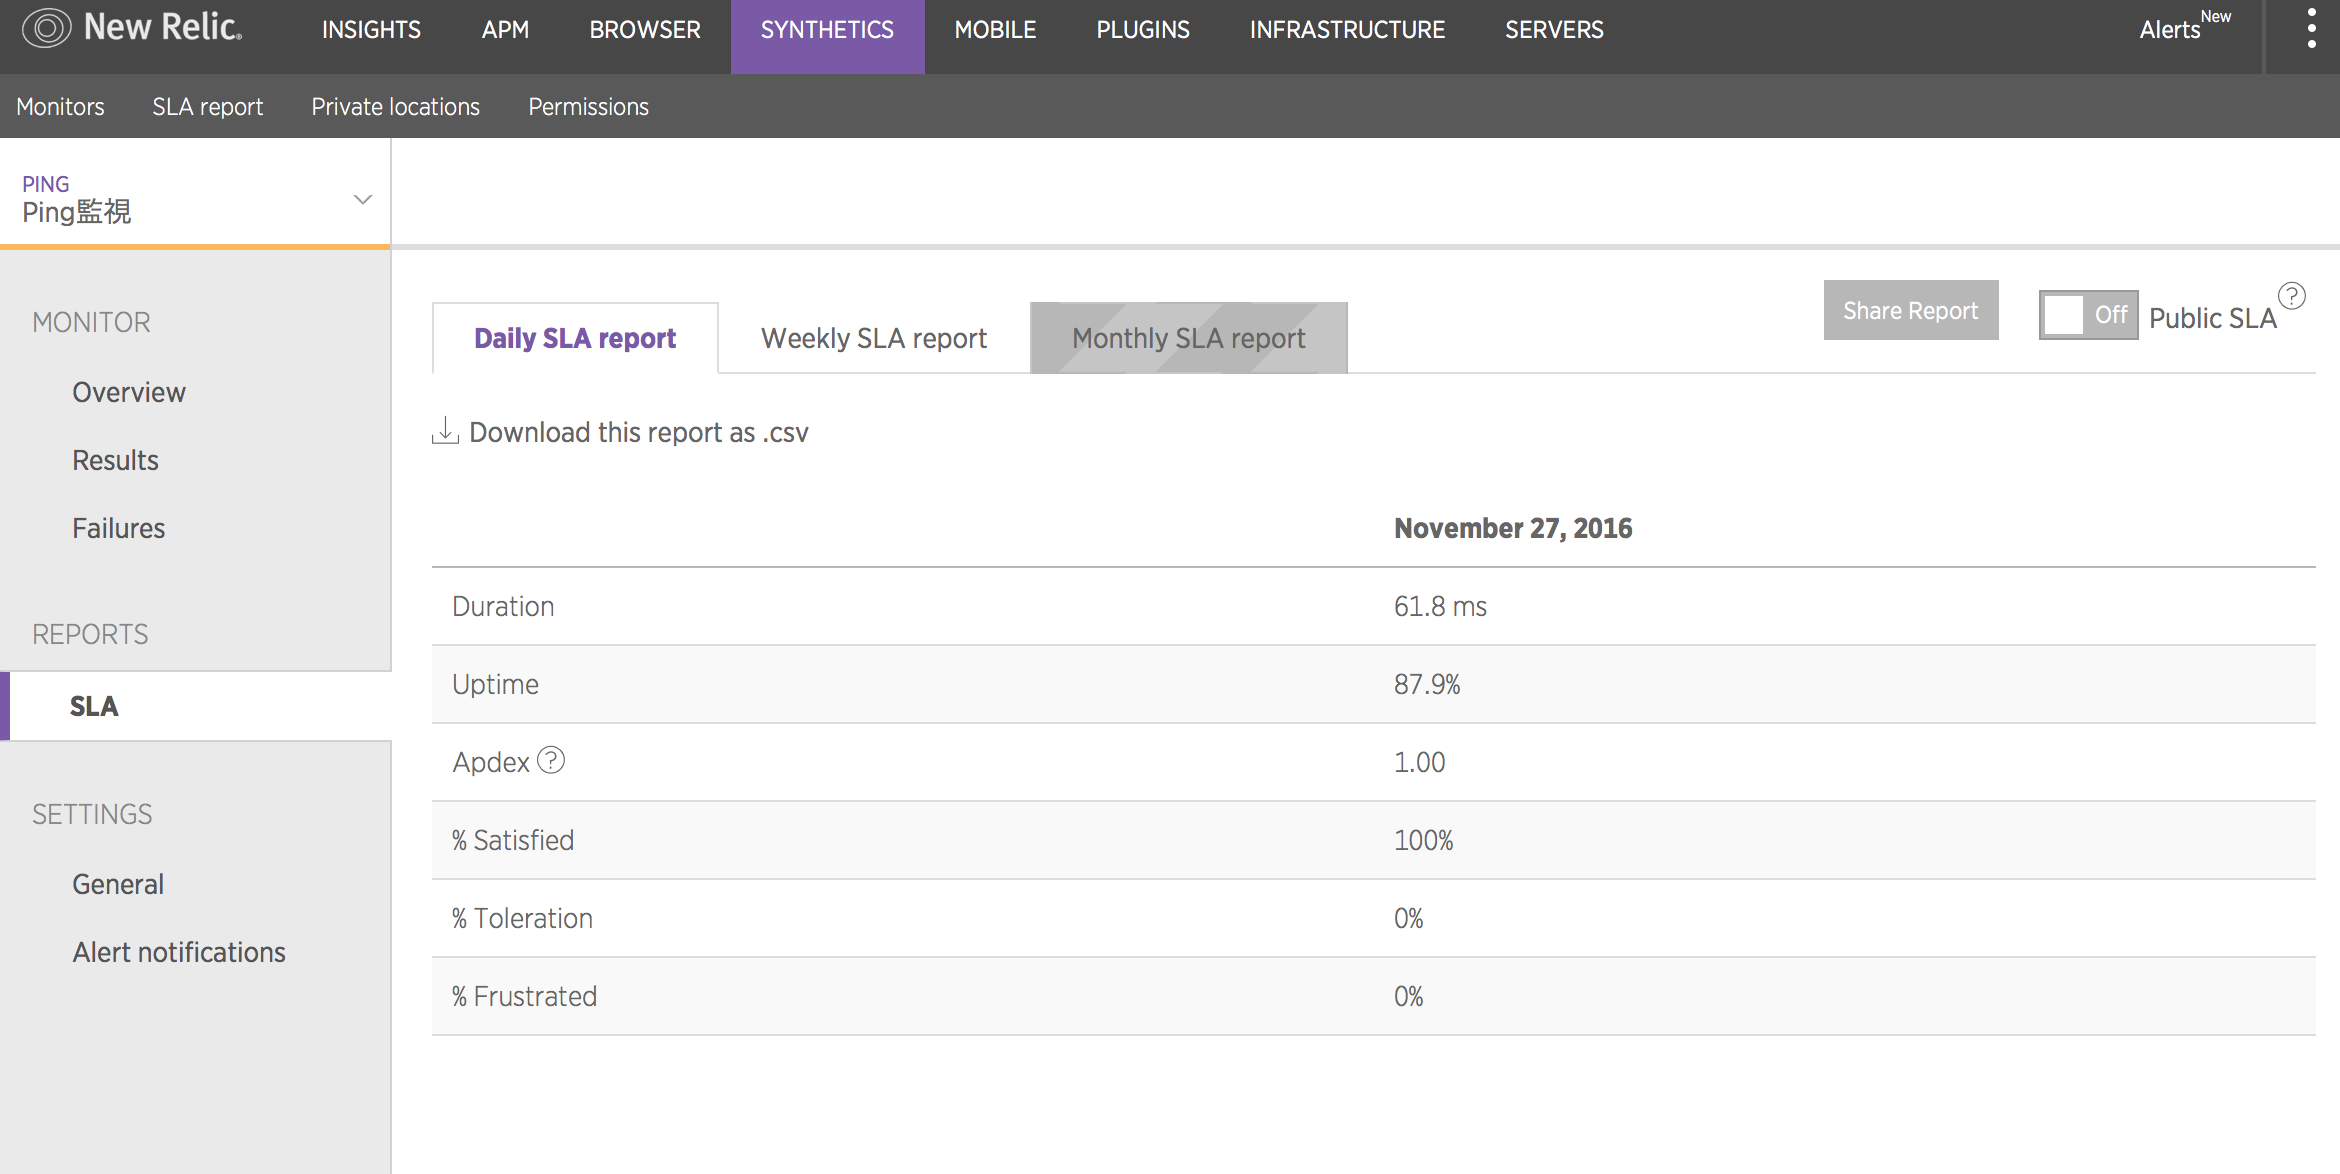
日毎、週毎、月毎のSLAレポートも自動生成できます。
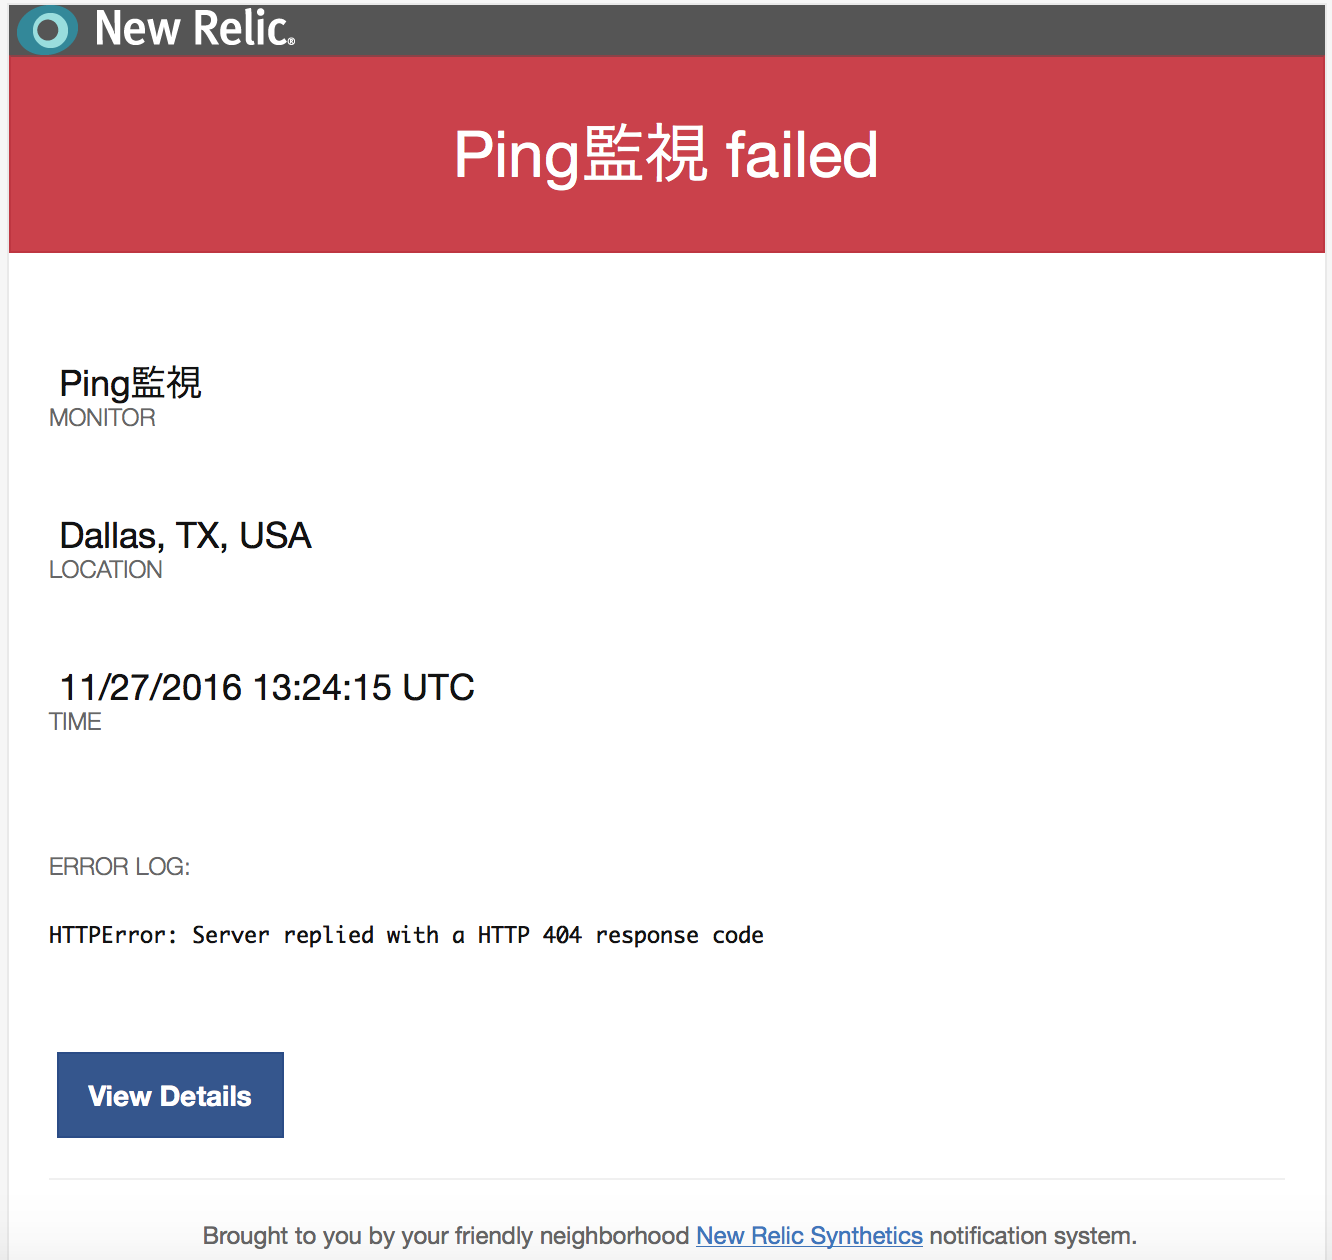
アラート通知の確認
監視対象のランタイムを停止します。す。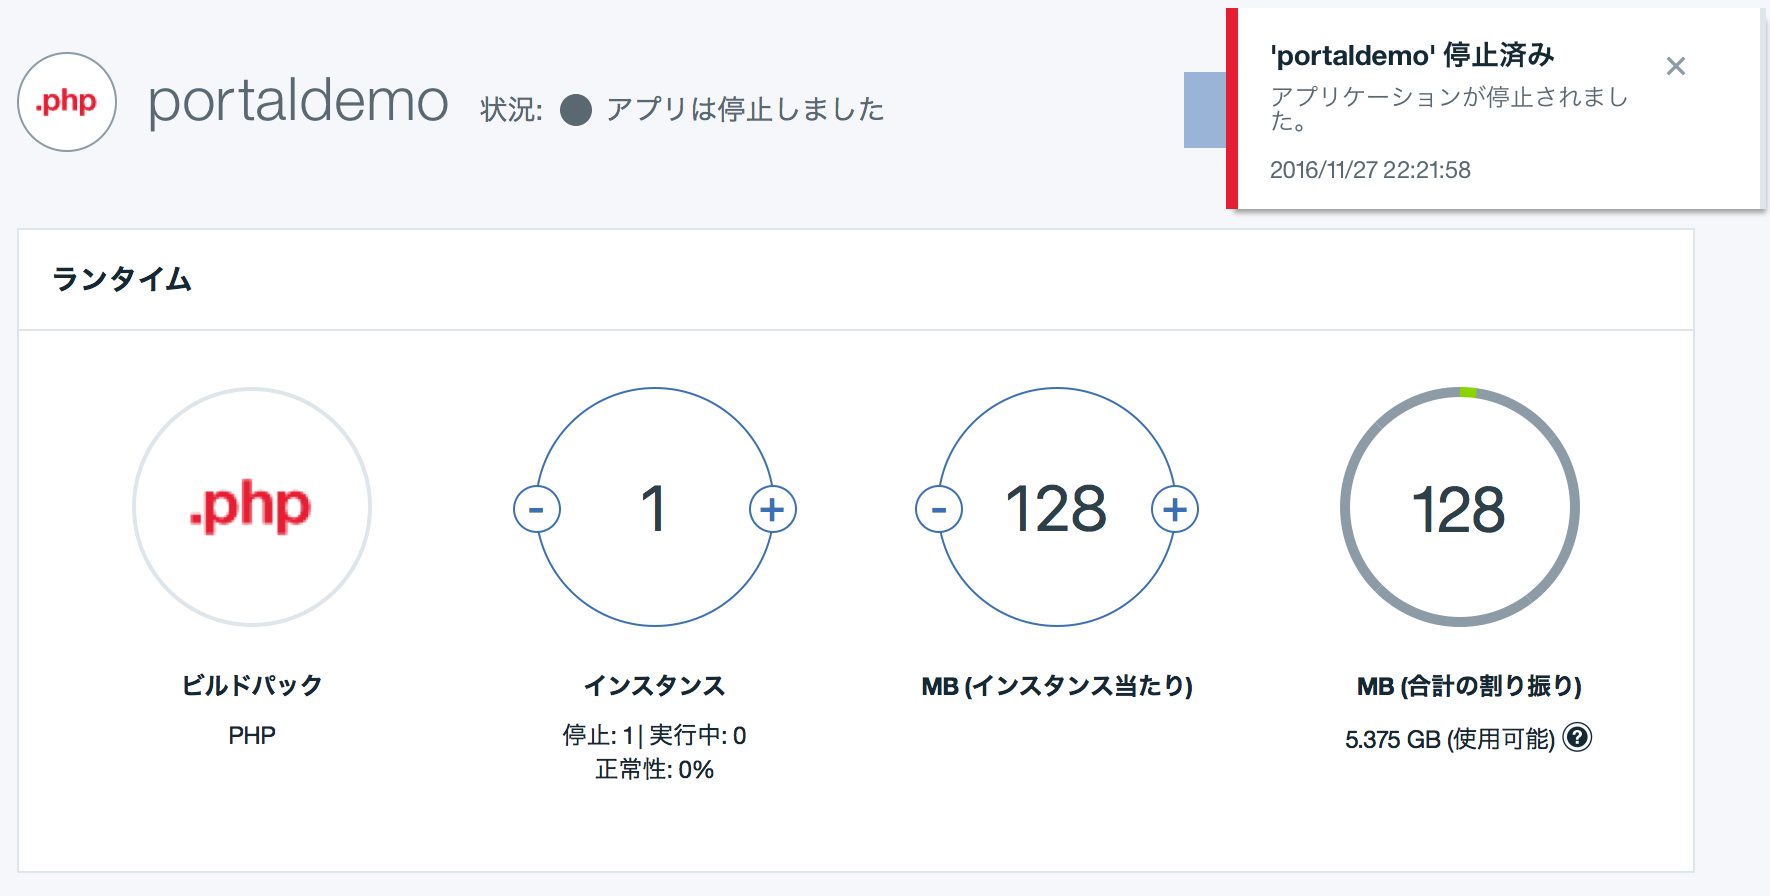
しばらくすると以下のようなアラートが検知されます。
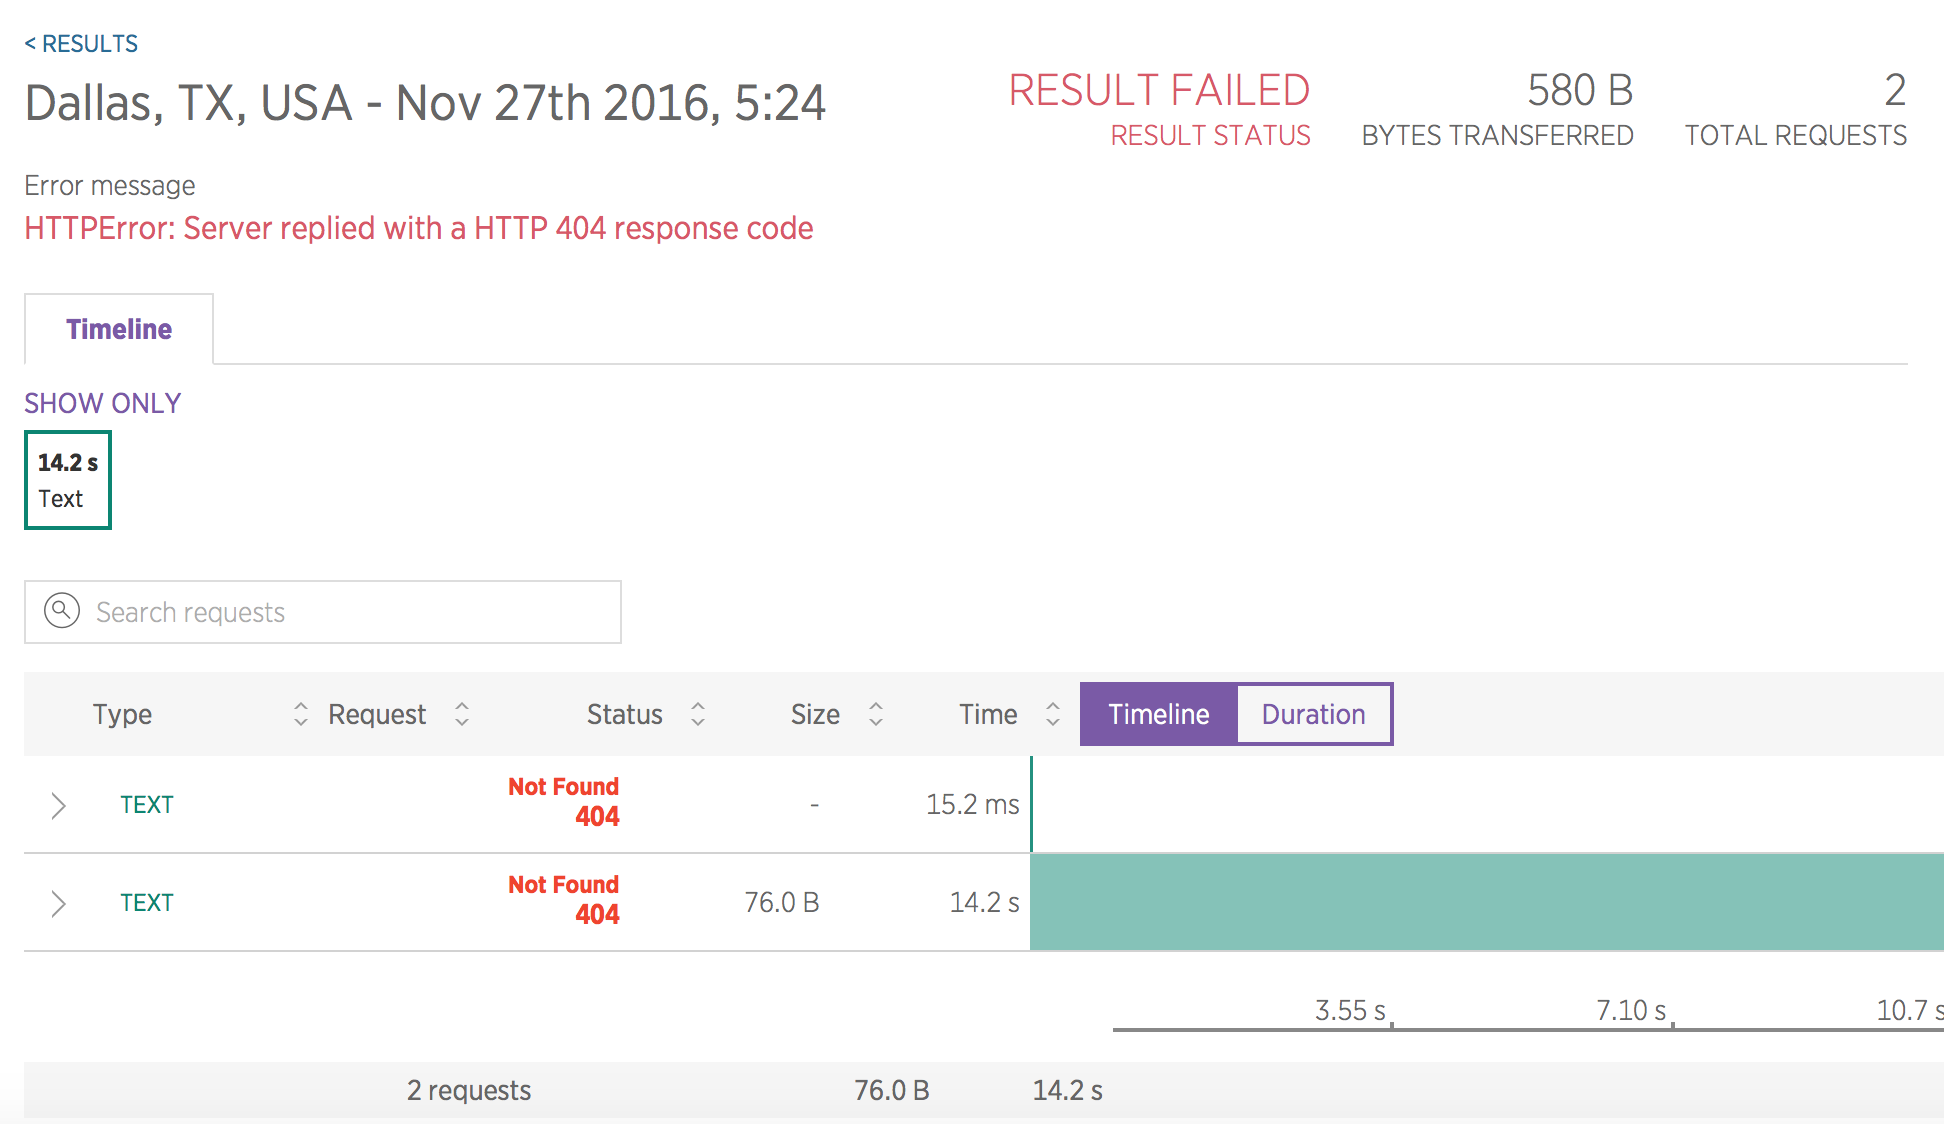
同様にメール通知もされます。
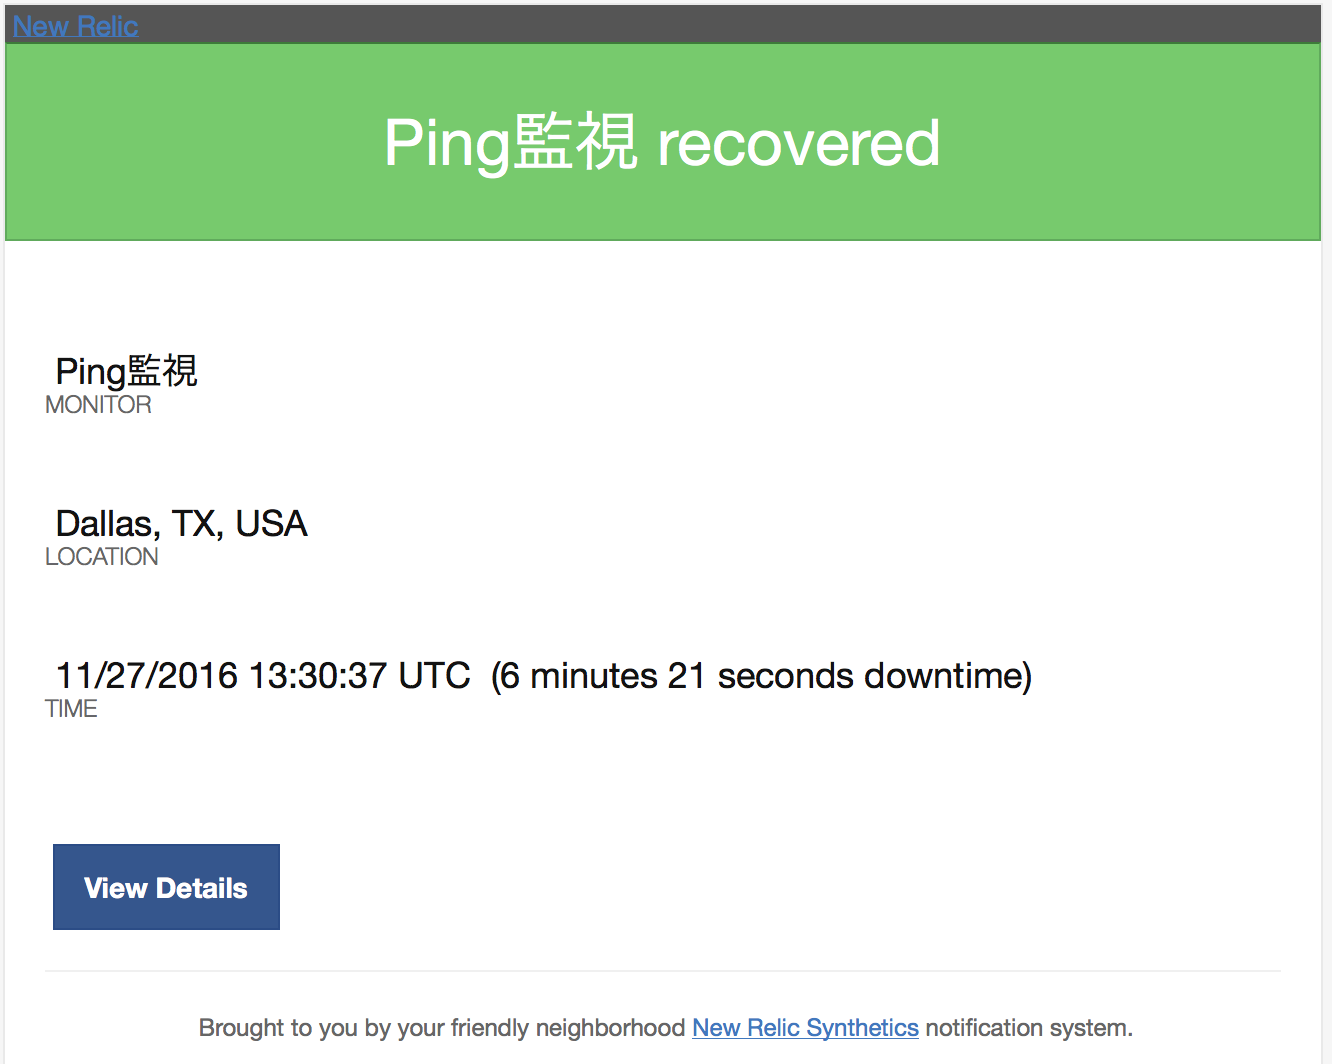
PHPランタイムを始動すると復旧が通知されます。
まとめ
今回は、Bluemix 3rd Party製品として登録されているクラウド型の監視ツールNew Relicを用いてBluemix Infrastructure (旧SoftLayer)の仮想サーバーとBluemixのPHPランタイムを監視する方法を確認しました。これまで多くの商用監視ツール、OSS監視ツールを使ってきましたが、これほど簡単に高度なモニタリングができるサービスは初めてです。これまでNew Relicといえば、アプリケーション層のパフォーマンス監視サービスという印象が強かったですが、サーバーのパフォーマンスもばっちり監視できることが分かりました。今回試したのはNew Relic INFRASTRUCTURE、SYNTHETICSのごく一部の機能だけで、まだまだ機能はたくさんあるようなので今後他の機能も試していきたいと思います。IBMクラウドを支える強力な監視サービスとして活用できそうです。