はじめに
この記事は#30DayMapChallenge2022 21日目の記事です。
テーマはData: Kontur Polulation Datasetです。
OpenLayersを使って東京都の人口のポリゴンデータを表示してみます。
OpenLayersとは
簡単にダイナミックなマップを設置することができるJavaScriptライブラリ
地図タイル、ベクトルデータ、マーカーを表示することができる
フリーかつオープンソースで、2条項のBSDライセンス(FreeBSDとしても知られています)の下でリリースされている
執筆時の最新バージョンはv7.1.0でした
ポリゴンデータを取得する
今回はGeoJSONを使って表示してみます。
国土数値情報から東京都の人口データをダウンロードします。
https://nlftp.mlit.go.jp/ksj/gml/datalist/KsjTmplt-W05.html
中身はシェープファイルとGeoJSONだったので、GeoJSONを使います。
ポリゴンデータを表示する
公式のサンプルコードを参考に実装します。
index.html
<!DOCTYPE html>
<html lang="ja">
    <head>
        <meta charset="utf-8" />
        <title>サンプル</title>
        <meta name="description" content="サンプルです" />
        <link href="style.css" rel="stylesheet" />
        <!-- OpenLayers -->
        <script src="https://cdn.jsdelivr.net/npm/ol@v7.1.0/dist/ol.js"></script>
        <link rel="stylesheet" href="https://cdn.jsdelivr.net/npm/ol@v7.1.0/ol.css" />
    </head>
    <body>
        <div id="map"></div>
        <script src="main.js"></script>
    </body>
</html>
style.css
body {
    margin: 0;
    padding: 0;
}
#map {
    position: absolute;
    top: 0;
    bottom: 0;
    width: 100%;
}
main.js
const style = {
    Polygon: new ol.style.Style({
        stroke: new ol.style.Stroke({
            color: 'blue',
            lineDash: [4],
            width: 3,
        }),
        fill: new ol.style.Fill({
            color: 'rgba(0, 0, 255, 0.1)',
        }),
    }),
};

const styleFunction = function (feature) {
    return style[feature.getGeometry().getType()];
};

const vectorSource = new ol.source.Vector({
    url: 'data/population_polygon.geojson',
    format: new ol.format.GeoJSON(),
    attributions: 'データの出典:国土数値情報(人口集中地区データ)(国土交通省)',
});

const vectorLayer = new ol.layer.Vector({
    source: vectorSource,
    style: styleFunction,
});

const map = new ol.Map({
    layers: [new ol.layer.Tile({ source: new ol.source.OSM() }), vectorLayer],
    view: new ol.View({
        center: ol.proj.transform([139.5986, 35.68833], 'EPSG:4326', 'EPSG:3857'),
        zoom: 11,
    }),
    target: 'map',
});
ポリゴンデータのスタイルを定義します
GeoJSONを読み込み、スタイルを設定します。
Mapオブジェクトに作成したレイヤを追加します。
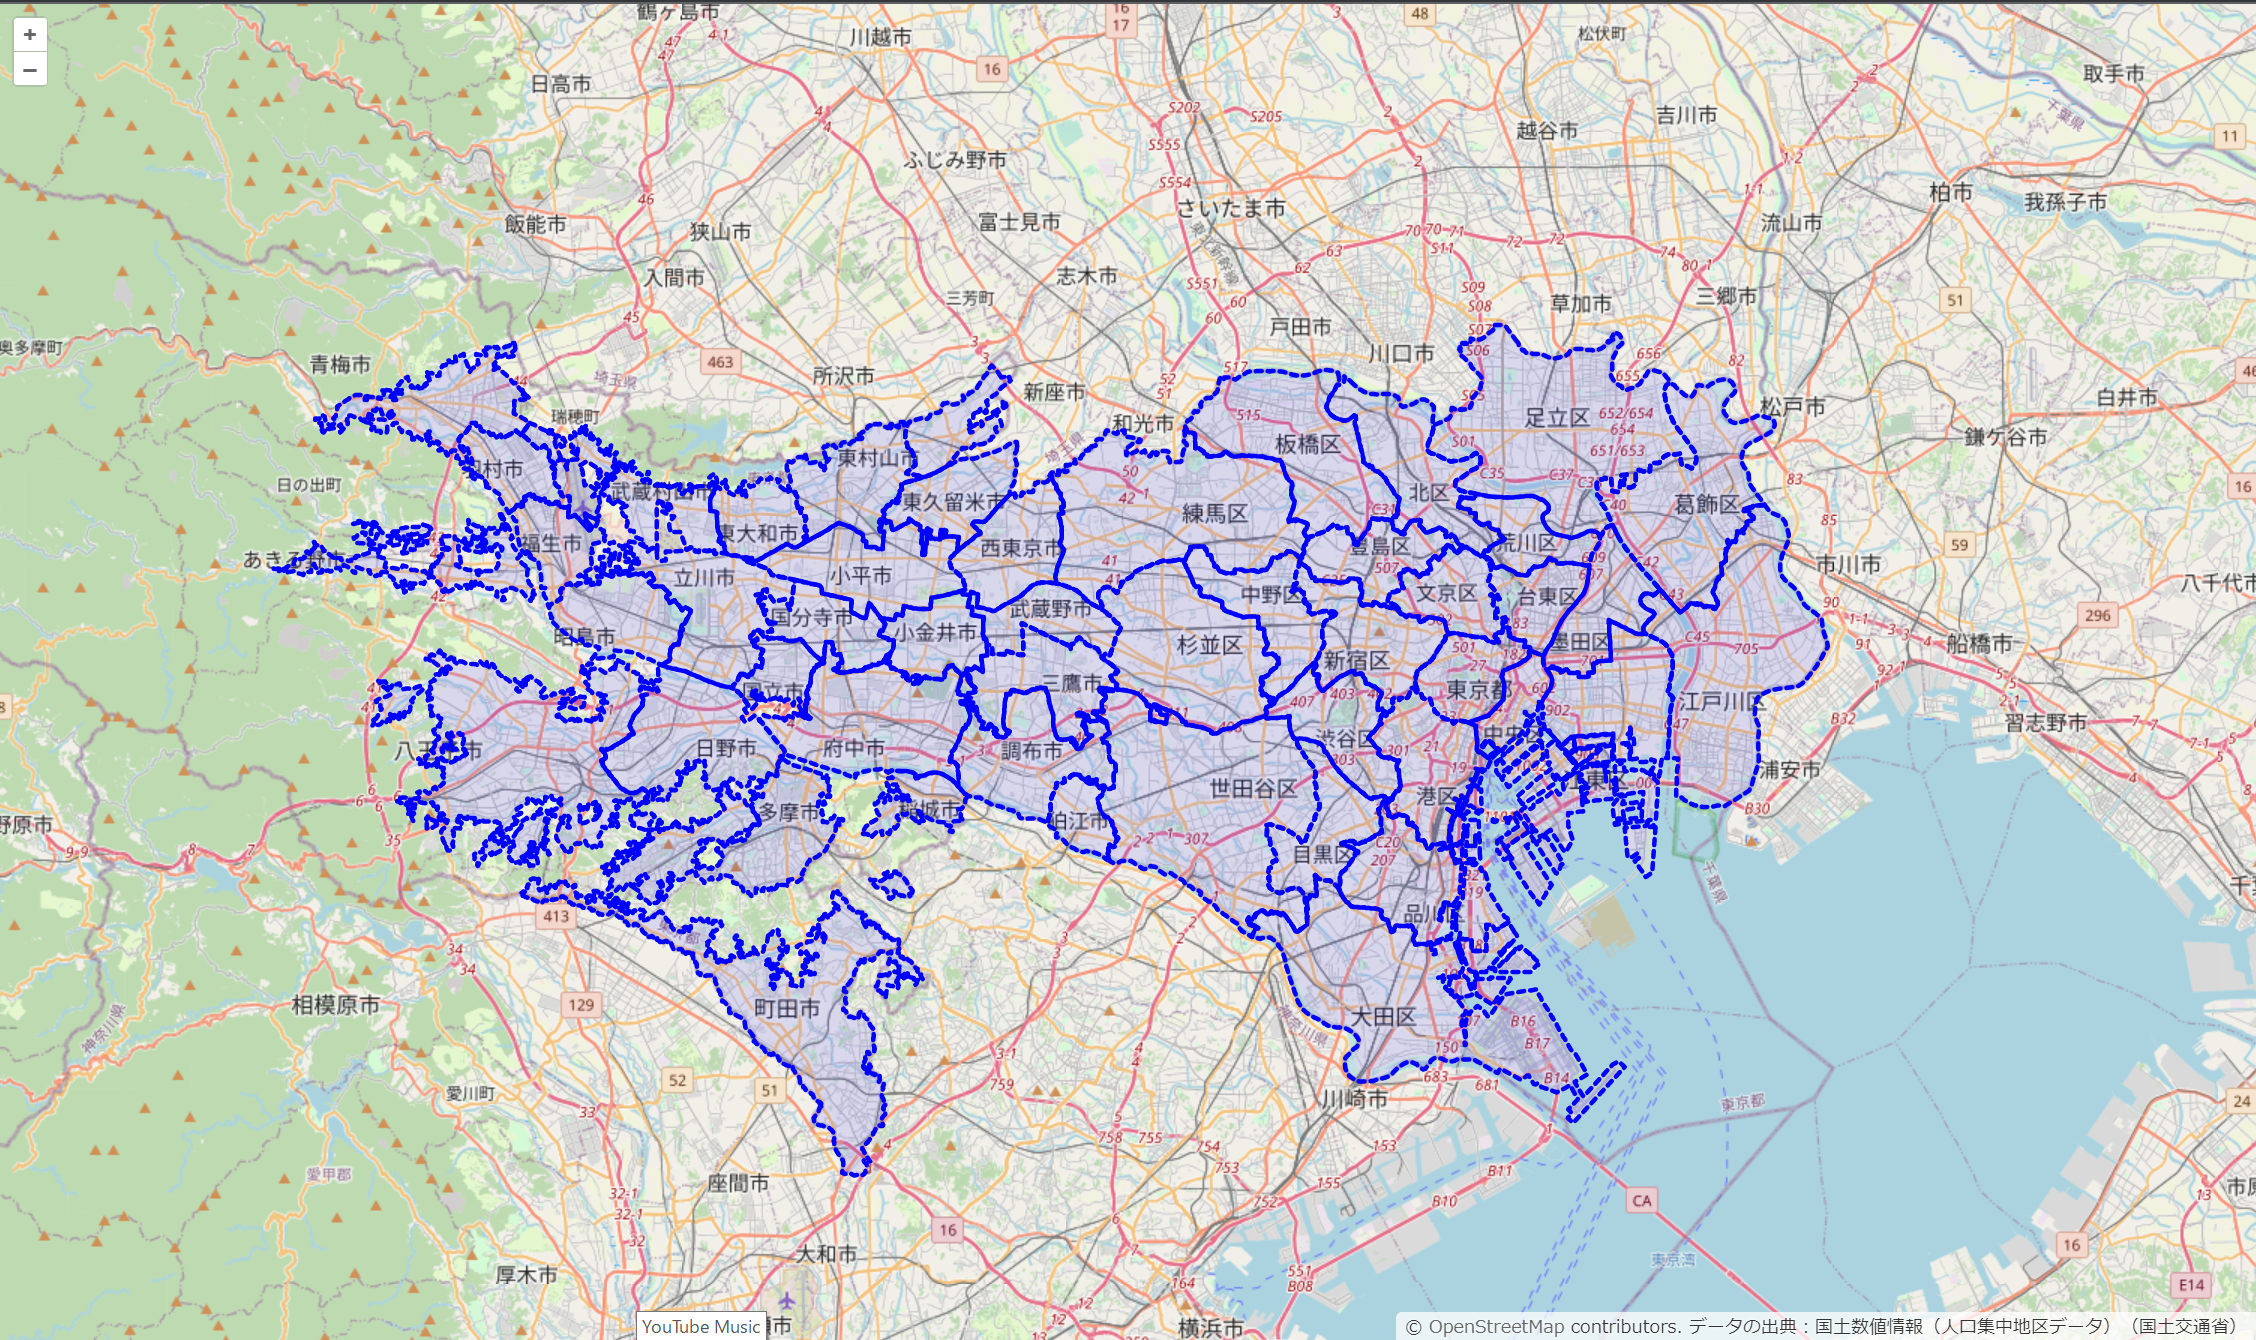
ポリゴンデータを表示できました!
せっかくなので人口も表示してみましょう
ポップアップで属性を表示する
公式のサンプルコードを参考に実装します。
index.html
<!DOCTYPE html>
<html lang="ja">
    <head>
        <meta charset="utf-8" />
        <title>サンプル</title>
        <meta name="description" content="サンプルです" />
        <link href="style.css" rel="stylesheet" />
        <!-- OpenLayers -->
        <script src="https://cdn.jsdelivr.net/npm/ol@v7.1.0/dist/ol.js"></script>
        <link rel="stylesheet" href="https://cdn.jsdelivr.net/npm/ol@v7.1.0/ol.css" />
    </head>
    <body>
        <div id="map"></div>
        <div id="popup" class="ol-popup">
            <a href="#" id="popup-closer" class="ol-popup-closer"></a>
            <div id="popup-content"></div>
        </div>
        <script src="main.js"></script>
    </body>
</html>
style.css
body {
    margin: 0;
    padding: 0;
}
#map {
    position: absolute;
    top: 0;
    bottom: 0;
    width: 100%;
}
.ol-popup {
    position: absolute;
    background-color: white;
    box-shadow: 0 1px 4px rgba(0, 0, 0, 0.2);
    padding: 15px;
    border-radius: 10px;
    border: 1px solid #cccccc;
    bottom: 12px;
    left: -50px;
    min-width: 280px;
}
.ol-popup:after,
.ol-popup:before {
    top: 100%;
    border: solid transparent;
    content: ' ';
    height: 0;
    width: 0;
    position: absolute;
    pointer-events: none;
}
.ol-popup:after {
    border-top-color: white;
    border-width: 10px;
    left: 48px;
    margin-left: -10px;
}
.ol-popup:before {
    border-top-color: #cccccc;
    border-width: 11px;
    left: 48px;
    margin-left: -11px;
}
.ol-popup-closer {
    text-decoration: none;
    position: absolute;
    top: 2px;
    right: 8px;
}
.ol-popup-closer:after {
    content: '✖';
}
main.js
const style = {
    Polygon: new ol.style.Style({
        stroke: new ol.style.Stroke({
            color: 'blue',
            lineDash: [4],
            width: 3,
        }),
        fill: new ol.style.Fill({
            color: 'rgba(0, 0, 255, 0.1)',
        }),
    }),
};

const styleFunction = function (feature) {
    return style[feature.getGeometry().getType()];
};

const vectorSource = new ol.source.Vector({
    url: 'data/population_polygon.geojson',
    format: new ol.format.GeoJSON(),
    attributions: 'データの出典:国土数値情報(人口集中地区データ)(国土交通省)',
});

const vectorLayer = new ol.layer.Vector({
    source: vectorSource,
    style: styleFunction,
});

// ポップアップの設定
const container = document.getElementById('popup');
const content = document.getElementById('popup-content');
const closer = document.getElementById('popup-closer');

const overlay = new ol.Overlay({
    element: container,
    autoPan: {
        animation: {
            duration: 250,
        },
    },
});

// ポップアップを閉じる
closer.onclick = function () {
    overlay.setPosition(undefined);
    closer.blur();
    return false;
};

const map = new ol.Map({
    layers: [new ol.layer.Tile({ source: new ol.source.OSM() }), vectorLayer],
    overlays: [overlay],
    view: new ol.View({
        center: ol.proj.transform([139.5986, 35.68833], 'EPSG:4326', 'EPSG:3857'),
        zoom: 11,
    }),
    target: 'map',
});

map.on('click', function (evt) {
    map.forEachFeatureAtPixel(evt.pixel, function (feature, layer) {
        content.innerHTML = '<p>市町村名称: ' + feature.getProperties().市町村名称 + '</p>' + '<p>人口: ' + feature.getProperties().人口 + '</p>';
        overlay.setPosition(evt.coordinate);
    });
});
先ほどのソースコードに、ポップアップの設定を追加します。
ポリゴンをクリックすると、ポップアップが出て、GeoJSONで定義されている市町村の名前と人口が表示されるようにします。
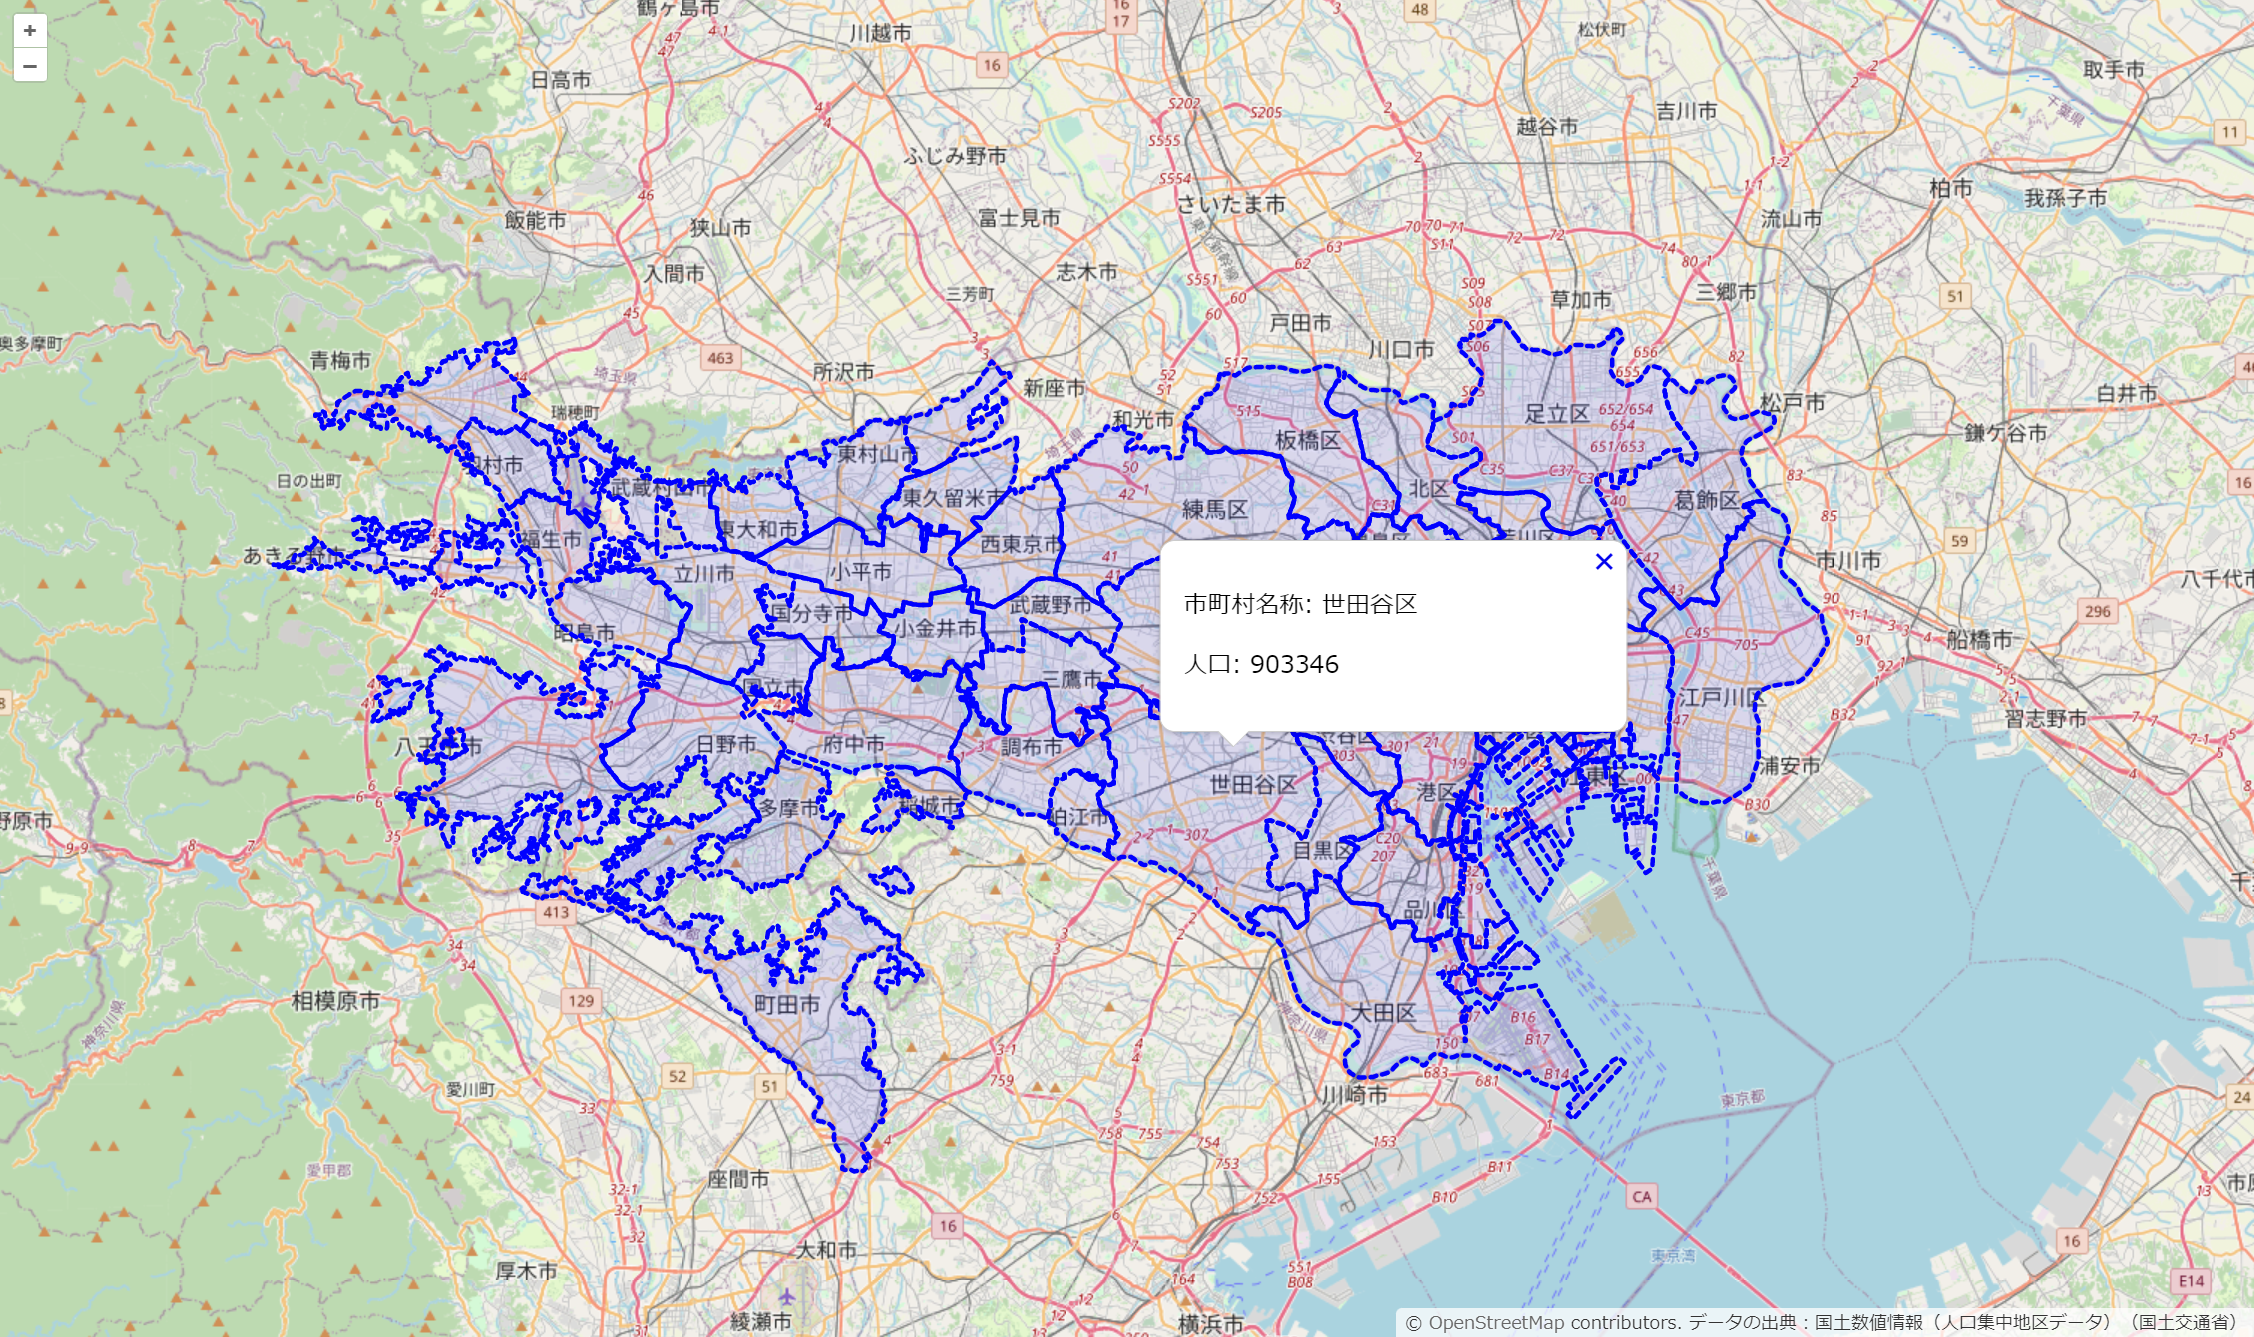
ポリゴンをぽちっとクリックしたらポップアップが出るようになりました!
ポップアップ表示も、OpenLayersよりもLeafletやMapLibre GL JSの方がさくっと作れますね。。
参考文献