1
1

Delete article

Deleted articles cannot be recovered.

Draft of this article would be also deleted.

Are you sure you want to delete this article?

More than 1 year has passed since last update.

【QGIS】シェープファイルを表示する

Posted at

はじめに

この記事は#30DayMapChallenge2022 26日目の記事です。
テーマはIsland(s)です。
QGISを使って小笠原諸島のポリゴンデータを表示してみます。

image

QGISとは

フリーでオープンソースの地理情報システム
ほとんどのUnixプラットフォーム、Windows、macOS上で動作する

シェープファイルとは

Esriが提唱したGISデータフォーマット
地物の位置や形状、属性情報を持つベクターデータを格納できる
複数のファイルから構成されており、必須のファイルはshp, shx, dbfの3つ

事前準備

既にインストール済みのQGIS(バージョン3.22.3)を使います。
QGISを開きます。
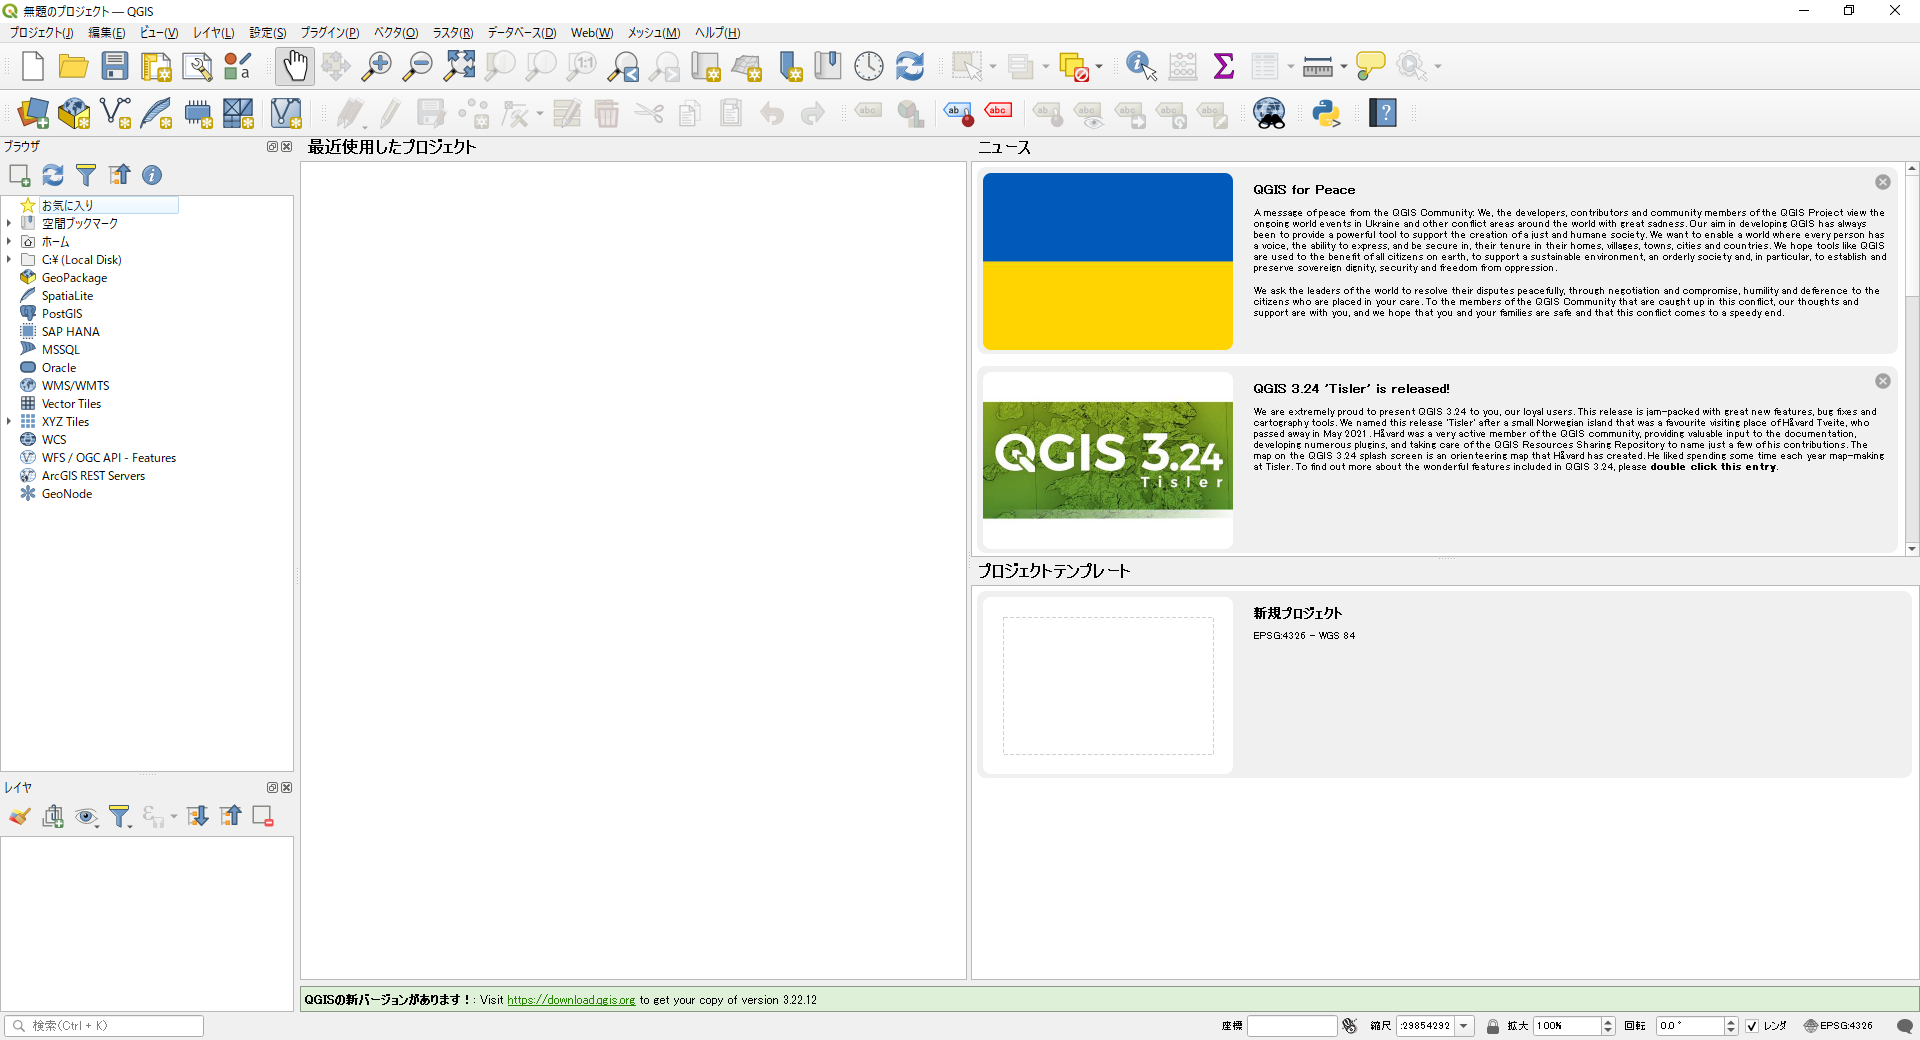
image.png

データダウンロード

国土数値情報から小笠原諸島データをダウンロードします。

サイトにアクセスして、最新年度のファイルをダウンロードします。
ダウンロードしたZIPファイルを展開します。

ファイルの中身はこんな感じでした。

image

データ表示

拡張子が.shpファイルを選択してドラッグ&ドロップします、または
レイヤタブから、レイヤを追加>ベクタレイヤを追加をクリックします。

image

ソースタイプはファイルを選択し、ソースから拡張子が.shpファイルを選択します。
入力できたら「追加」をクリックします。
image

image

小笠原諸島のポリゴンデータを表示できました!

参考文献

1
1
0

Register as a new user and use Qiita more conveniently

  1. You get articles that match your needs
  2. You can efficiently read back useful information
  3. You can use dark theme
What you can do with signing up
1
1

Delete article

Deleted articles cannot be recovered.

Draft of this article would be also deleted.

Are you sure you want to delete this article?