はじめに
この記事は#30DayMapChallenge2022 28日目の記事です。
テーマは3Dです。
MapLibre GL JSを使って東京23区のPLATEAUデータを表示してみます。
PLATEAUとは
国土交通省が主導する3D都市モデル整備・活用・オープンデータ化プロジェクトです。
3D都市モデルには、家屋やビルなどの「建築物」、都市計画区域などの「都市計画決定情報」、土地の用途を示した「土地利用」、都市のインフラである「道路」や「橋梁」など、都市に関するデータが格納されています。
PLATEAUデータについて
データ形式
PLATEAUデータには、様々なデータ形式があります。
例えば、CityGML、3D Tiles、MVT、ファイルジオデータベース、OBJ、FBXなどなど。。
今回はMapLibre GL JSで表示可能なMVTを採用します。
MVT
Mapbox Vector Tileの略で、ベクトルタイルのデータ形式です。
Google Protobufs (PBF) としてエンコードされています。
GeoJSONと比較してファイルサイズが小さく、Webやスマホアプリなどの利用に適しています。
データの取得
データはG空間情報センターからダウンロード可能です。
また、PLATEAU公式がPLATEAU配信サービス(試験運用)で3D Tilesを配信しています。
今回は、インディゴ株式会社さんが公開しているMVT形式のデータを利用します。
LOD
LOD(Level of Detail)とは、3D都市モデルに含まれている地物の詳細度です。
建築物はLOD0からLOD4までが定義されています。
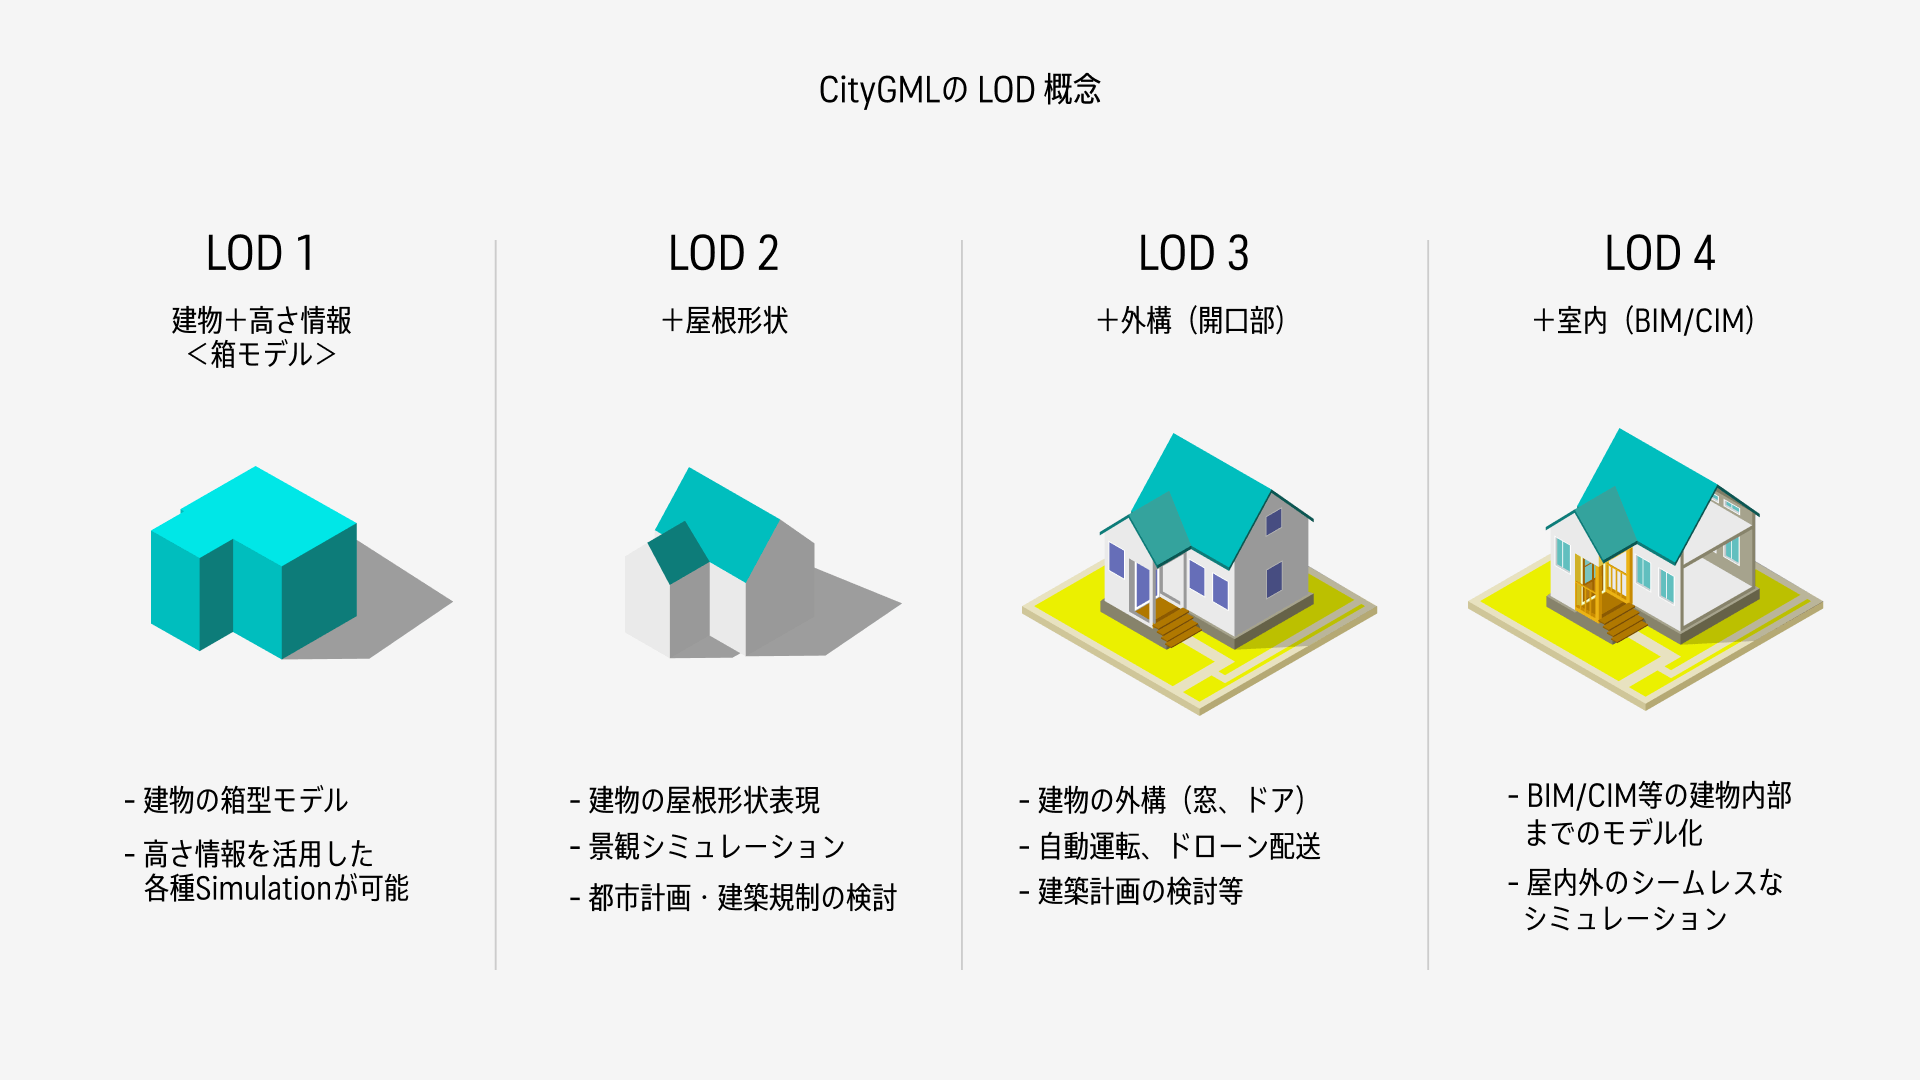
画像の出典:国土交通省 Project PLATEAU
データ表示
インディゴ株式会社さんが公開しているソースコードを参考に実装します。
<!DOCTYPE html>
<html lang="ja">
    <head>
        <meta charset="utf-8" />
        <title>サンプル</title>
        <meta name="description" content="サンプルです" />
        <link href="style.css" rel="stylesheet" />
        <!-- MapLibre -->
        <script src="https://unpkg.com/maplibre-gl@2.4.0/dist/maplibre-gl.js"></script>
        <link href="https://unpkg.com/maplibre-gl@2.4.0/dist/maplibre-gl.css" rel="stylesheet" />
    </head>
    <body>
        <div id="map"></div>
        <script src="main.js"></script>
    </body>
</html>
body {
    margin: 0;
    padding: 0;
}
#map {
    position: absolute;
    top: 0;
    bottom: 0;
    width: 100%;
}
const style = {
    version: 8,
    sources: {
        rtile: {
            type: 'raster',
            tiles: ['https://cyberjapandata.gsi.go.jp/xyz/std/{z}/{x}/{y}.png'],
            tileSize: 256,
            attribution: "地図の出典:<a href='https://www.gsi.go.jp/' target='_blank'>地理院タイル</a>",
        },
        plateau: {
            type: 'vector',
            tiles: ['https://indigo-lab.github.io/plateau-tokyo23ku-building-mvt-2020/{z}/{x}/{y}.pbf'],
            minzoom: 10,
            maxzoom: 16,
            attribution:
                "データの出典:<a href='https://github.com/indigo-lab/plateau-tokyo23ku-building-mvt-2020'>plateau-tokyo23ku-building-mvt-2020 by indigo-lab</a> (<a href='https://www.mlit.go.jp/plateau/'>国土交通省 Project PLATEAU</a> のデータを加工して作成)",
        },
    },
    layers: [
        {
            id: 'rtile',
            type: 'raster',
            source: 'rtile',
            minzoom: 5,
            maxzoom: 20,
        },
        {
            id: 'bldg',
            type: 'fill-extrusion',
            source: 'plateau',
            'source-layer': 'bldg',
            minzoom: 10,
            maxzoom: 20,
            paint: {
                'fill-extrusion-color': '#797979',
                'fill-extrusion-height': ['get', 'measuredHeight'],
            },
        },
    ],
};
var map = new maplibregl.Map({
    container: 'map',
    style: style, // 地図のスタイル
    center: [139.745461, 35.65856], // 中心座標
    zoom: 14, // ズームレベル
    pitch: 45, // 傾き
});
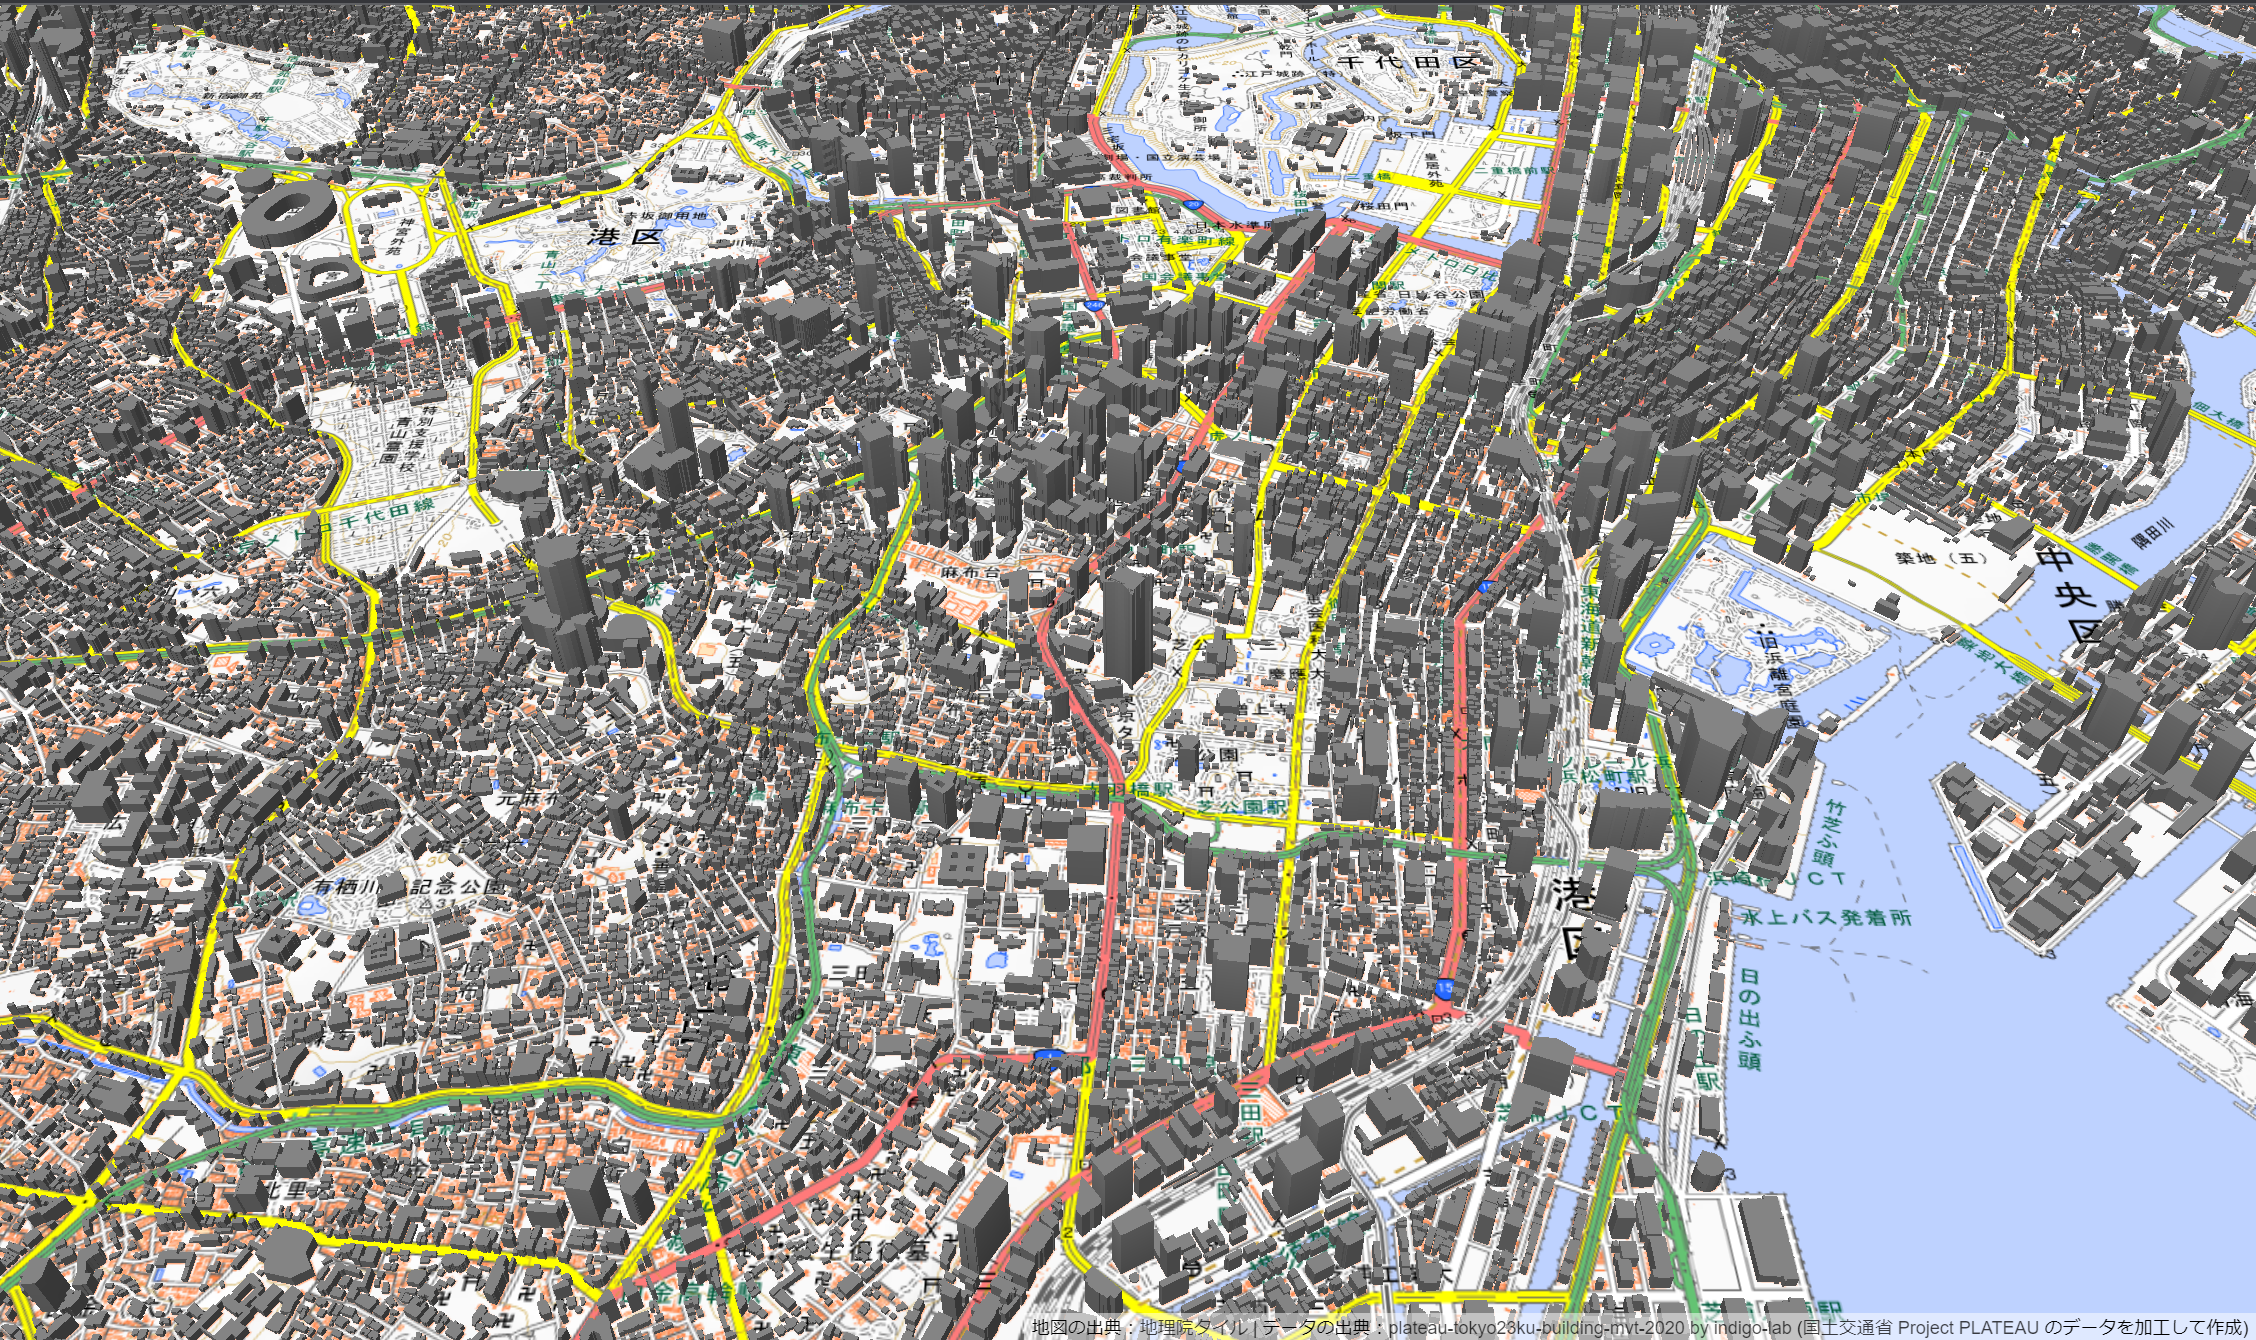
MVT形式のPLATEAUデータを表示できました!
さくさく動いていいですね~
参考文献