はじめに
この記事は#30DayMapChallenge2022 16日目の記事です。
テーマはMinimalです。
OpenLayersを使って国土地理院のベクトルタイルを表示してみます。
OpenLayersとは
簡単にダイナミックなマップを設置することができるJavaScriptライブラリ
地図タイル、ベクトルデータ、マーカーを表示することができる
フリーかつオープンソースで、2条項のBSDライセンス(FreeBSDとしても知られています)の下でリリースされている
執筆時の最新バージョンはv7.1.0でした
ベクトルタイルを表示する
国土地理院のベクトルタイルを表示してみます。
index.html
<!DOCTYPE html>
<html lang="ja">
    <head>
        <meta charset="utf-8" />
        <title>サンプル</title>
        <meta name="description" content="サンプルです" />
        <link href="style.css" rel="stylesheet" />
        <!-- OpenLayers -->
        <script src="https://cdn.jsdelivr.net/npm/ol@v7.1.0/dist/ol.js"></script>
        <link rel="stylesheet" href="https://cdn.jsdelivr.net/npm/ol@v7.1.0/ol.css" />
    </head>
    <body>
        <div id="map"></div>
        <script src="main.js"></script>
    </body>
</html>
style.css
body {
    margin: 0;
    padding: 0;
}
#map {
    position: absolute;
    top: 0;
    bottom: 0;
    width: 100%;
}
main.js
const vectorLayer = new ol.layer.VectorTile({
    declutter: true,
    source: new ol.source.VectorTile({
        minzoom: 4,
        maxZoom: 16,
        format: new ol.format.MVT(),
        url: 'https://cyberjapandata.gsi.go.jp/xyz/experimental_bvmap/{z}/{x}/{y}.pbf',
        attributions: "出典:<a href='https://www.gsi.go.jp/' target='_blank'>国土地理院ベクトルタイル提供実験</a>",
    }),
});

const map = new ol.Map({
    layers: [vectorLayer],
    view: new ol.View({
        center: ol.proj.transform([138.68786, 38.68355], 'EPSG:4326', 'EPSG:3857'),
        zoom: 6,
    }),
    target: 'map',
});
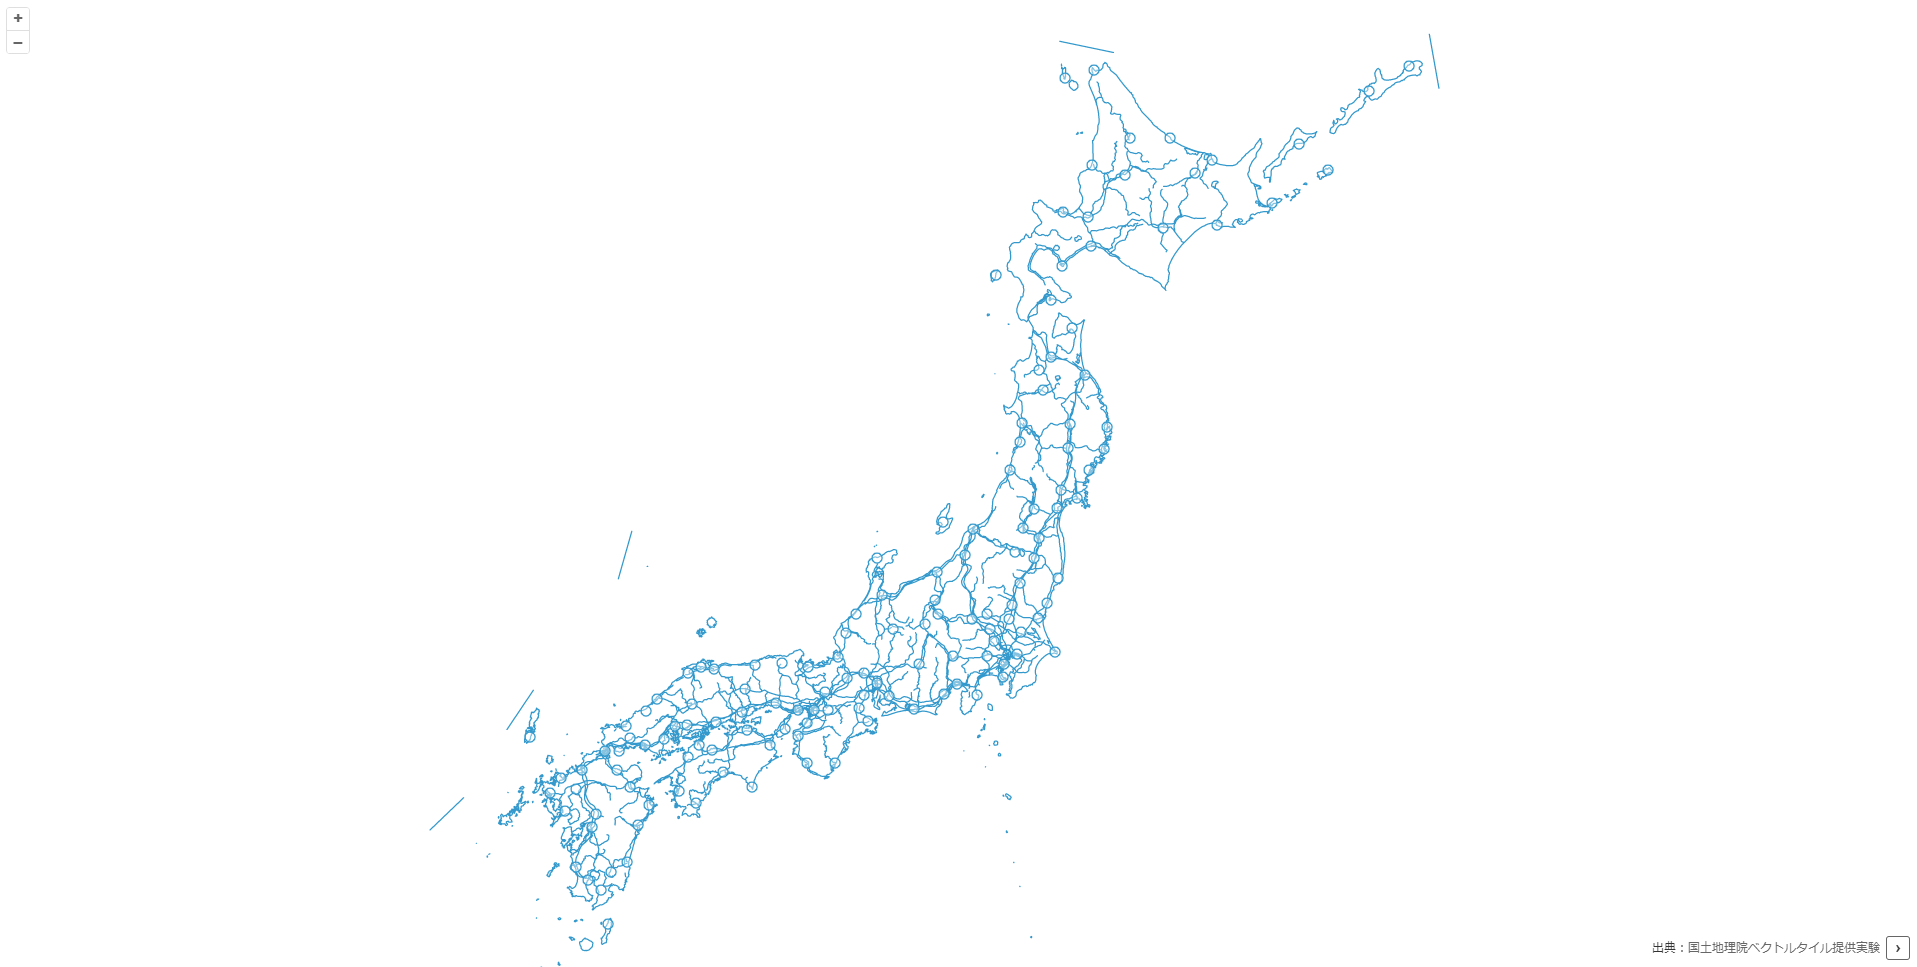
ベクトルタイルといえばMapbox GL JS/MapLibre GL JSでしたが、OpenLayersでも表示できるんですね~
参考文献