はじめに
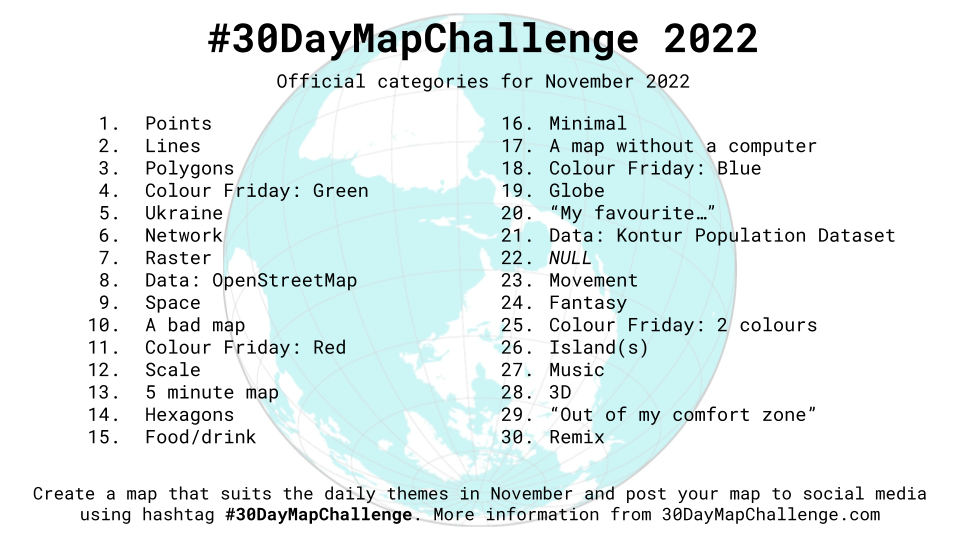
この記事は#30DayMapChallenge2022 3日目の記事です。
テーマはPolygonsです。
MapLibre GL JSを使ってPolygonデータを地図上に表示してみます。
Polygonとは
ベクタデータの3要素(ポイント・ライン・ポリゴン)のうちの1つ。
終点を始点に一致させた多角形の面を指します。
地図表示
船橋市周辺を表示してみます。
<!DOCTYPE html>
<html lang="ja">
<head>
    <meta charset="utf-8">
    <title>サンプル</title>
    <meta name="description" content="サンプルです">
    <link href="style.css" rel="stylesheet">
    <!-- MapLibre -->
    <script src='https://unpkg.com/maplibre-gl@2.4.0/dist/maplibre-gl.js'></script>
    <link href='https://unpkg.com/maplibre-gl@2.4.0/dist/maplibre-gl.css' rel='stylesheet' />
</head>
<body>
    <div id="map"></div>
    <script src="main.js"></script>
</body>
</html>
html, body{
    height: 100%;
 }

#map{
   height: 100%;
}
var map =  new maplibregl.Map({
    container: 'map',
    style: 'https://tile.openstreetmap.jp/styles/osm-bright-ja/style.json', // 地図のスタイル
    center: [140.01162, 35.72270], // 中心座標
    zoom: 12, // ズームレベル
    pitch: 0 // 傾き
})
ポリゴンデータ取得
今回はGeoJSONを使って表示してみます。
農林水産省から千葉県船橋市の筆ポリゴンデータをダウンロードします。
https://open.fude.maff.go.jp/
元ファイルの測地系がJGD2011だったので、QGISでWGS84 (EPSG:4326)に変換しました。
筆ポリゴンとは・・
「筆ポリゴン」とは、GIS(地理情報システム)ソフトウェア等において利用可能な農地の区画情報であり、
農林水産省統計部が標本調査として実施する耕地面積調査等の母集団情報として整備したものを基とするデータです。
引用元:
これがポリゴンデータ!
ポリゴンデータ表示
ポリゴンデータが入ったGeoJSONを読み込んで、ポリゴンを表示してみます
var map =  new maplibregl.Map({
    container: 'map',
    style: 'https://tile.openstreetmap.jp/styles/osm-bright-ja/style.json', // 地図のスタイル
    center: [140.01162, 35.72270], // 中心座標
    zoom: 12, // ズームレベル
    pitch: 0 // 傾き
})

+map.on('load', function () {
+    map.addSource('funabashi_fudepolygon', {
+        type: 'geojson',
+        data: './data/funabashi_fudepolygon.geojson',
+    });
+    map.addLayer({
+        id: 'funabashi_fudepolygon',
+        type: 'fill',
+        source: 'funabashi_fudepolygon',
+        layout: {},
+        paint: {
+            'fill-color': '#84C98B',
+            'fill-opacity': 0.8,
+        },
+    });
+});
ポリゴンデータを表示できました~
ズームレベルを上げるとこんな感じ
境界線を追加
ポリゴンの外枠の線をつけて境界線を強調してみます。
var map = new maplibregl.Map({
    container: 'map',
    style: 'https://tile.openstreetmap.jp/styles/osm-bright-ja/style.json', // 地図のスタイル
    center: [140.01162, 35.7227], // 中心座標
    zoom: 12, // ズームレベル
    pitch: 0, // 傾き
});

map.on('load', function () {
    map.addSource('funabashi_fudepolygon', {
        type: 'geojson',
        data: './data/funabashi_fudepolygon.geojson',
    });
    map.addLayer({
        id: 'funabashi_fudepolygon_fill',
        type: 'fill',
        source: 'funabashi_fudepolygon',
        layout: {},
        paint: {
            'fill-color': '#84C98B',
            'fill-opacity': 0.8,
        },
    });
+    map.addLayer({
+        id: 'funabashi_fudepolygon_border',
+        type: 'line',
+        source: 'funabashi_fudepolygon',
+        layout: {},
+        paint: {
+            'line-color': '#2B6442',
+            'line-width': 1,
+        },
+    });
+});
先ほどよりも見やすくなりました!
ホバー効果を追加
ホバーさせたときにポリゴンの色を強調するようにしてみます
サンプルコードを参考にしてもうまくいかず、ハマりました。。
うまくいかなかった例
筆ポリゴンのGeoJSONのうち、polygon_uuidを指定してホバーの状態設定を追加しました
{
    "type": "FeatureCollection",
    "name": "funabashi_fudepolygon",
    "crs": {
        "type": "name",
        "properties": { "name": "urn:ogc:def:crs:OGC:1.3:CRS84" }
    },
    "features": [
        {
            "type": "Feature",
            "properties": {
                "polygon_uuid": "24239baf-eaba-4564-94df-1181ac188c3e",
                "land_type": 100,
                "issue_year": 2022,
                "edit_year": 2020,
                "history": [
                    {
                        "筆ポリゴンID": "6279e023-3bfe-44cb-ae05-db97b1b1a7a9",
                        "更新年度": 2021,
                        "前年同一": true
                    },
                    {
                        "筆ポリゴンID": "6279e023-3bfe-44cb-ae05-db97b1b1a7a9",
                        "発生年度": 2020
                    }
                ],
                "last_polygon_uuid": "6279e023-3bfe-44cb-ae05-db97b1b1a7a9",
                "prev_last_polygon_uuid": null,
                "local_government_cd": "122041",
                "point_lng": 140.06773222699999,
                "point_lat": 35.790787183
            },
            "geometry": {
                "type": "Polygon",
                "coordinates": [
                    [
                        [140.067575487, 35.791039821],
                        [140.067643035, 35.791054446],
                        [140.067835147000011, 35.790875656],
                        [140.067908488, 35.790620635],
                        [140.067887004999989, 35.790593847],
                        [140.067667849, 35.790569337],
                        [140.067615983, 35.790813035],
                        [140.067575487, 35.791039821]
                    ]
                ]
            }
        },
        (略)
var map = new maplibregl.Map({
    container: 'map',
    style: 'https://tile.openstreetmap.jp/styles/osm-bright-ja/style.json', // 地図のスタイル
    center: [140.067575487, 35.791039821], // 中心座標
    zoom: 18, // ズームレベル
    pitch: 0, // 傾き
});

+var hoveredStateId = null;

map.on('load', function () {
    map.addSource('funabashi_fudepolygon', {
        type: 'geojson',
        data: './data/funabashi_fudepolygon.geojson',
    });
    map.addLayer({
        id: 'funabashi_fudepolygon_fill',
        type: 'fill',
        source: 'funabashi_fudepolygon',
        layout: {},
        paint: {
            'fill-color': '#84C98B',
-            'fill-opacity': 0.8,
+            'fill-opacity': [
+                'case',
+                ['boolean', ['feature-state', 'hover'], false],
+                1,
+                0.5,
+            ],
        },
    });
    map.addLayer({
        id: 'funabashi_fudepolygon_border',
        type: 'line',
        source: 'funabashi_fudepolygon',
        layout: {},
        paint: {
            'line-color': '#2B6442',
            'line-width': 1,
        },
    });

+    map.on('mousemove', 'funabashi_fudepolygon_fill', function (e) {
+        if (e.features.length > 0) {
+            if (hoveredStateId) {
+                map.setFeatureState(
+                    { source: 'funabashi_fudepolygon', id: hoveredStateId },
+                    { hover: false }
+                );
+            }
+            hoveredStateId = e.features[0].properties.polygon_uuid;
+            alert(hoveredStateId); // 確認用
+            map.setFeatureState(
+                { source: 'funabashi_fudepolygon', id: hoveredStateId },
+                { hover: true }
+            );
+        }
+    });
+
+    map.on('mouseleave', 'funabashi_fudepolygon_fill', function () {
+        if (hoveredStateId) {
+            map.setFeatureState(
+                { source: 'funabashi_fudepolygon', id: hoveredStateId },
+                { hover: false }
+            );
+        }
+        hoveredStateId = null;
+    });
+});
hoveredStateIdは取れているのですが、フィーチャーの状態を設定できていないようでした。

すかさず公式のリファレンスを確認。
feature-state
Retrieves a property value from the current feature's state. Returns null if the requested property is not present >on the feature's state. A feature's state is not part of the GeoJSON or vector tile data, and must be set >programmatically on each feature. When source.promoteId is not provided, features are identified by their id >attribute, which must be an integer or a string that can be cast to an integer. When source.promoteId is provided, >features are identified by their promoteId property, which may be a number, string, or any primitive data type. >Note that ["feature-state"] can only be used with paint properties that support data-driven styling.
日本語訳して一部抜粋
フィーチャーはその id 属性で識別され、integer または integer にキャスト可能な文字列である必要があります。
な、なにいいいい!
指定したpolygon_uuidは数字でないため、うまく機能しなかったみたい。
公式で使っているGeoJSONを確認。
{
    "type": "FeatureCollection",
    "features": [
        {
            "type": "Feature",
            "geometry": {
                "type": "Polygon",
                "coordinates": [
                    [
                        [-80.519, 40.6388],
                        (略)
                    ]
                ]
            },
            "properties": { "STATE_ID": "54", "STATE_NAME": "West Virginia" },
            "id": 54
        },
featuresにidがいる・・
ということで、元データを加工してfeaturesに数字が入ったid属性を付与することにしました。
うまくいった例
筆ポリゴンのGeoJSONに数字が入ったid属性を付与します。
(元データに数値の属性があれば必要ありません)
全部やるのは大変なので、一部だけやりました。全部やるならプログラムで一気にやらないときつそう。
{
    "type": "FeatureCollection",
    "name": "funabashi_fudepolygon",
    "crs": {
        "type": "name",
        "properties": { "name": "urn:ogc:def:crs:OGC:1.3:CRS84" }
    },
    "features": [
        {
            "type": "Feature",
            "properties": {
                "polygon_uuid": "24239baf-eaba-4564-94df-1181ac188c3e",
                "land_type": 100,
                "issue_year": 2022,
                "edit_year": 2020,
                "history": [
                    {
                        "筆ポリゴンID": "6279e023-3bfe-44cb-ae05-db97b1b1a7a9",
                        "更新年度": 2021,
                        "前年同一": true
                    },
                    {
                        "筆ポリゴンID": "6279e023-3bfe-44cb-ae05-db97b1b1a7a9",
                        "発生年度": 2020
                    }
                ],
                "last_polygon_uuid": "6279e023-3bfe-44cb-ae05-db97b1b1a7a9",
                "prev_last_polygon_uuid": null,
                "local_government_cd": "122041",
                "point_lng": 140.06773222699999,
                "point_lat": 35.790787183
            },
+            "id": 1,
            "geometry": {
                "type": "Polygon",
                "coordinates": [
                    [
                        [140.067575487, 35.791039821],
                        [140.067643035, 35.791054446],
                        [140.067835147000011, 35.790875656],
                        [140.067908488, 35.790620635],
                        [140.067887004999989, 35.790593847],
                        [140.067667849, 35.790569337],
                        [140.067615983, 35.790813035],
                        [140.067575487, 35.791039821]
                    ]
                ]
            }
        },
        (略)
idを指定してホバーの状態設定を追加しました。
var map = new maplibregl.Map({
    container: 'map',
    style: 'https://tile.openstreetmap.jp/styles/osm-bright-ja/style.json', // 地図のスタイル
    center: [140.067575487, 35.791039821], // 中心座標
    zoom: 18, // ズームレベル
    pitch: 0, // 傾き
});

+var hoveredStateId = null;

map.on('load', function () {
    map.addSource('funabashi_fudepolygon', {
        type: 'geojson',
        data: './data/funabashi_fudepolygon.geojson',
    });
    map.addLayer({
        id: 'funabashi_fudepolygon_fill',
        type: 'fill',
        source: 'funabashi_fudepolygon',
        layout: {},
        paint: {
            'fill-color': '#84C98B',
-            'fill-opacity': 0.8,
+            'fill-opacity': [
+                'case',
+                ['boolean', ['feature-state', 'hover'], false],
+                1,
+                0.5,
+            ],
        },
    });

+    map.on('mousemove', 'funabashi_fudepolygon_fill', function (e) {
+        if (e.features.length > 0) {
+            if (hoveredStateId) {
+                map.setFeatureState(
+                    { source: 'funabashi_fudepolygon', id: hoveredStateId },
+                    { hover: false }
+                );
+            }
+            hoveredStateId = e.features[0].id;
+            map.setFeatureState(
+                { source: 'funabashi_fudepolygon', id: hoveredStateId },
+                { hover: true }
+            );
+        }
+    });
+
+    map.on('mouseleave', 'funabashi_fudepolygon_fill', function () {
+        if (hoveredStateId) {
+            map.setFeatureState(
+                { source: 'funabashi_fudepolygon', id: hoveredStateId },
+                { hover: false }
+            );
+        }
+        hoveredStateId = null;
+    });
+});
ホバーしたらポリゴンの色が濃くなるようになりました~~!
NHKハッカソンの時に試してうまくいかず諦めたのですが、今回ちゃんと調べて解決できてよかったです(T_T)
2023/04/02 追記
generateId をTrueにすると、feature.idを自動的に割り当てることができます!
参考文献


