D3.jsを利用してグラフの連続描画を行います。
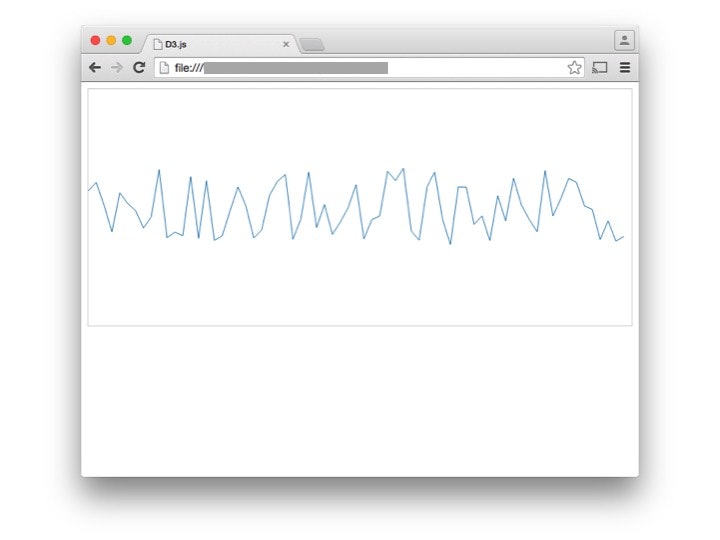
定期的にタイマーを起動して配列に乱数を追加してグラフを再描画します。
配列のサイズが上限に達したとき、先頭の配列を削除します。
sample.html
<html>
<head>
    <meta charset = "utf-8">
    <title>D3.js</title>
</head>

<body>

<script src="http://ajax.googleapis.com/ajax/libs/jquery/1.11.2/jquery.min.js"></script>
<script src="http://d3js.org/d3.v3.min.js" charset="utf-8"></script>
<div id="d3graph" style="border:1px solid #ccc; margin-bottom:10px"></div>

<script type="text/javascript">
var stage;
$(document).ready(function() {
    stage = d3.select("#d3graph").append("svg:svg").attr("width", $("#d3graph").width()).attr("height", 300);
    setInterval("update()",100);
});

var colors = d3.scale.category10();
var d3Line = d3.svg.line()
.x(function(d,i){return i * 10})
.y(function(d,i){return d});

var points = new Array();

function update() {
    points.push(Math.random() * 100 + 100);
    if(points.length > $("#d3graph").width()/10) {
        points.shift();
    }

    // 削除する
    stage.selectAll("path").remove();

    // 描画する
    stage.append("path")
    .attr("d", d3Line(points))
    .attr("stroke", colors(0))
    .attr("fill", "none")
    .attr("opacity", 1);

}
</script>

</body>
</html>
WebSocketと組み合わせると、センサ情報のリアルタイム描画が可能になります。