目次 ⇒ JFreeChartサンプル
package jp.avaj.lib.chart;
import java.lang.reflect.InvocationTargetException;
import java.util.ArrayList;
import java.util.List;
import java.util.Random;
import org.jfree.chart.ChartFrame;
import org.jfree.chart.JFreeChart;
import org.jfree.chart.axis.NumberAxis;
import org.jfree.chart.plot.Plot;
import org.jfree.chart.plot.XYPlot;
import org.jfree.chart.renderer.xy.XYItemRenderer;
import org.jfree.chart.renderer.xy.XYLineAndShapeRenderer;
import org.jfree.data.xy.XYDataset;
import org.jfree.data.xy.XYSeries;
import org.jfree.data.xy.XYSeriesCollection;
/**
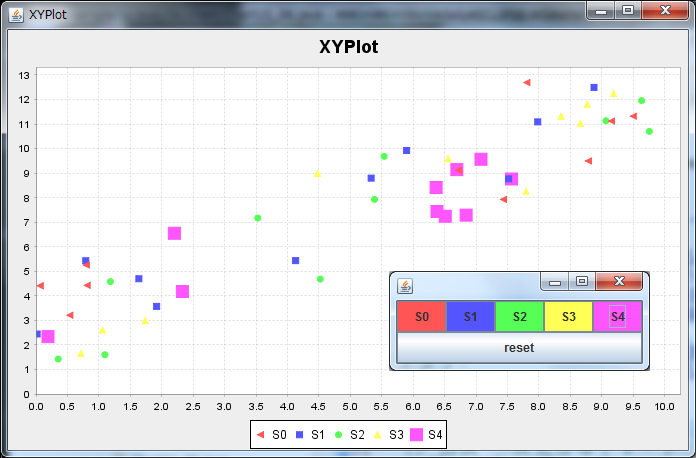
■ JFreeChart-二次元分布チャート-XYSeriesCollection-UIで特定データを強調する
・複数のデータが表示されていると分かりにくいことがある。
・ArcXYPlotEmphasizeWinを使うと、データ選択画面が表示され、特定のデータを強調表示できる.
・強調の方法はArcEmphasizeに定義されており、以下の方法がある。
・ITEM ⇒ ポイントを大きく表示する。
・LINE ⇒ 線を太く表示する。
・BLINK ⇒ ブリンクさせる.該当データを本来の色とグレイで交互表示する。0.5秒間隔。
・本サンプルではITEMを使用する。
*/
public class Chart15_06 {
// 目次-二次元分布チャート
A_Chart15 a_Chart15;
// 目次-Artery-JFreeChart用のライブラリ
A_Chart00 a_LibChartSampeContents;
public static void main(String[] args) throws NoSuchFieldException, SecurityException, IllegalArgumentException, IllegalAccessException, InvocationTargetException {
XYSeriesCollection dataSet = createXYDataset();
// (1)レンダラの指定
// 最初の引数はラインを引くかどうか⇒今回はラインは引かない
// 次の引数はデータの場所に形を表示するか否か⇒今回は形を表示する.
XYLineAndShapeRenderer renderer = new XYLineAndShapeRenderer(false,true);
// 軸の指定
NumberAxis xAxis = new NumberAxis();
NumberAxis yAxis = new NumberAxis();
// Plotの生成
XYPlot xyPlot = new XYPlot((XYDataset)dataSet,xAxis,yAxis,(XYItemRenderer)renderer);
// チャートを表示する
JFreeChart jfreeChart = new JFreeChart("XYPlot",(Plot)xyPlot);
ChartFrame cFrame = new ChartFrame("XYPlot",(JFreeChart)jfreeChart); // (1)
cFrame.pack();
cFrame.setVisible(true);
//
new ArcXYPlotEmphasizeWin(cFrame,xyPlot,ArcEmphasize.ITEM);
}
/** 表示データ(XYSeriesCollection)を作成する */
public static XYSeriesCollection createXYDataset() throws NoSuchFieldException, SecurityException, IllegalArgumentException, IllegalAccessException, InvocationTargetException {
XYSeriesCollection xySeriesCollection = new XYSeriesCollection();
Random ran = new Random();
for (int series = 0; series<5; series++) {
List<Z_XYPlotSample_11_Data> list = new ArrayList<Z_XYPlotSample_11_Data>();
for (int item = 0; item<10; item++) {
double x = ran.nextDouble()*10;
double y = x+ran.nextDouble()*5;
list.add(new Z_XYPlotSample_11_Data(x,y));
}
// ListからXYSeriesを生成する、x値,y値を取得するフィールド名を指定する
XYSeries xySeries = ArcXYSeries.create("S"+series,list,"x","y");
// XYSeriesCollecitonに追加する
xySeriesCollection.addSeries(xySeries);
}
return xySeriesCollection;
}
/** 元データを格納するクラス */
public static class Z_XYPlotSample_11_Data {
public Z_XYPlotSample_11_Data(double x,double y) {
this.x = x;
this.y = y;
}
private double x;
private double y;
public double getX() {
return x;
}
public void setX(double x) {
this.x = x;
}
public double getY() {
return y;
}
public void setY(double y) {
this.y = y;
}
}
}