目次 ⇒ JFreeChartサンプル
package jp.avaj.lib.chart;

import java.awt.BasicStroke;
import java.awt.Color;
import java.awt.Paint;
import java.awt.Stroke;

import org.jfree.chart.ChartFrame;
import org.jfree.chart.ChartPanel;
import org.jfree.chart.JFreeChart;
import org.jfree.chart.axis.NumberAxis;
import org.jfree.chart.axis.ValueAxis;
import org.jfree.chart.plot.Plot;
import org.jfree.chart.plot.XYPlot;
import org.jfree.chart.renderer.xy.XYItemRenderer;
import org.jfree.chart.renderer.xy.XYLineAndShapeRenderer;
import org.jfree.data.xy.XYDataset;
import org.jfree.data.xy.XYSeries;
import org.jfree.data.xy.XYSeriesCollection;

import jp.avaj.lib.test.L;

/**
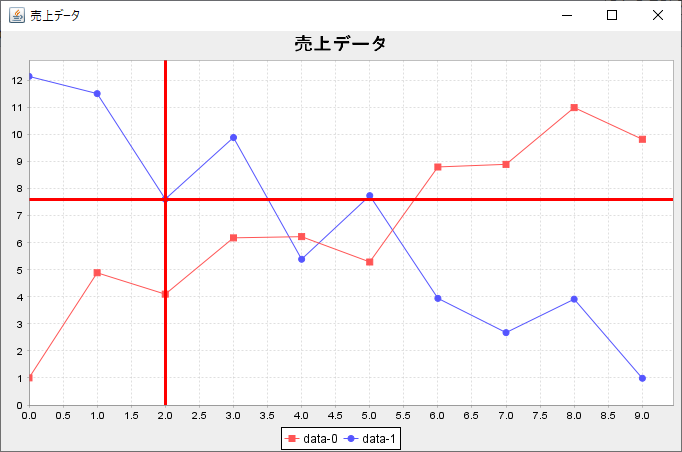
■ JFreeChart-XYPlot-クリック時に値を取得し十字線を表示する-ArcXYPlotMouseClickedHandlerを使用-ArcXYPlotMouseClickedHandlerを使用

・概要と注意事項.
  ・ChartPanelにMouseListenerを設定する.
  ・クリックした時に十字線を表示する.
    ・この時の対象位置は、クリック点の位置ではなく、対角線で一番近い点である.
    ・グラフからちょっと離れた部分をクリックしてみるとよい.
  ・MouseListener中でデータを取得すると前回クリックのデータが取得される.
    ・本サンプルではArcXYPlotMouseClickedHandlerを使用している.
      ・上記ハンドラではスレッドを回して値を取得している.
      ・取得した値は上記ハンドラに当クラスのオブジェクトをリスナーとして登録して取得する.
  ・取得されたデータはdoubleなので、意味のある値(例えば日付など)に変換が必要な場合がある.
  ・値は取得できるが、グラフは取得できないので、取得された値から検索する必要がある.

 */
public class Chart19_03 implements ArcXYPlotMouseMovedHandlerListener {

  public static void main(String[] args) {
    new Chart19_03();
  }

  public Chart19_03() {
    // テストデータを生成する
    XYDataset dataset = createDataset();
    //
    NumberAxis yAxis = new NumberAxis();
    yAxis.setAutoRangeIncludesZero(true);
    NumberAxis xAxis = new NumberAxis();
    XYLineAndShapeRenderer xyLineAndShapeRenderer = new XYLineAndShapeRenderer();
    XYPlot xyPlot = new XYPlot(dataset,(ValueAxis)xAxis,(ValueAxis)yAxis,(XYItemRenderer)xyLineAndShapeRenderer);
    // 十字線の属性の登録
    {
      BasicStroke stroke = new BasicStroke(3.0F);
      xyPlot.setDomainCrosshairStroke((Stroke)stroke);
      xyPlot.setRangeCrosshairStroke((Stroke)stroke);
      Color color = Color.red;
      xyPlot.setDomainCrosshairPaint((Paint)color);
      xyPlot.setRangeCrosshairPaint((Paint)color);
    }
    JFreeChart jfreeChart = new JFreeChart("売上データ",(Plot)xyPlot);
    //
    ChartFrame cFrame = new ChartFrame("売上データ",(JFreeChart)jfreeChart);
    cFrame.pack();
    cFrame.setVisible(true);

    // ハンドラの登録
    ArcXYPlotMouseClickedHandler handler = new ArcXYPlotMouseClickedHandler(xyPlot);
    ChartPanel chartPanel = cFrame.getChartPanel();
    chartPanel.addMouseListener(handler);
    // ハンドラに自オブジェクトをリスナーとして登録
    handler.addArXYPlotMouseMovedHandlerListener(this);
  }

  @Override
  public void gotValue(ArcXYPlotMouseClickedInfo info) {
    L.p("X="+info.x);
    L.p("Y="+info.y);
  }

  /** テストデータを作成する */
  private static XYDataset createDataset() {
    XYSeriesCollection dataset = new XYSeriesCollection();
    // 一本目
    XYSeries xySeries = new XYSeries("data-0");
    for (int j=0; j<10; j++) {
      xySeries.add(j,j+Math.random()*4.0D);
    }
    dataset.addSeries(xySeries);
    // 二本目
    xySeries = new XYSeries("data-1");
    for (int j=0; j<10; j++) {
      xySeries.add(j,9-j+Math.random()*4.0D);
    }
    dataset.addSeries(xySeries);
    return dataset;
  }
}
/*-結果------------------------------------------------
X=8.0
Y=3.9133258018654384
X=2.0
Y=7.613969720945024
-----------------------------------------------------*/
