はじめに
似た画像の検出は画像認識におけるよく利用される機能の一つです。
レコメンドシステムや検索システムでは数万、数十万という画像を利用することも少なくありません。
画像のサイズや比較方法にもよりますが、数千、数万枚のなかから似た画像を検索するのは膨大な処理時間が必要になります。
そこでk-meansとPCAを利用してデータ量や比較回数を削減して似た画像を検出する方法を考えます。
Face Recognition
顔の特徴は以下のURLのライブラリで実装できる、128次元のベクトルで表されるface_landmarkを利用します。
https://github.com/ageitgey/face_recognition
PCA後の次元数は寄与率を見つつ20としました。PCAを行って次元削減をした後にk-meansによってK=10のクラスタに分類します。
各クラスタの重心から最も近いものを算出し、最も重心が近いクラスタに分類された画像のみ距離を算出して似た画像を検出します。
また、画像の特徴をPCAで削減したデータで保存することで保存容量の削減にも有効です。
1000枚の画像を利用した場合、k-means方によるクラスタリングによって平均100回+10回(各クラスタの重心との比較)の比較で済むようになります。
また各ベクトルの次元数もPCAによって128次元から20次元に削減されているため、効果的に計算量を削減することができます。
http://mmlab.ie.cuhk.edu.hk/projects/CelebA.html
今回はこちらのフリーの顔画像を利用したサンプルソースを下記します。
プログラム
# coding:utf-8
import dlib
from imutils import face_utils
import cv2
import glob
import face_recognition
from sklearn.decomposition import PCA
from sklearn.cluster import KMeans
from matplotlib import pyplot as plt
import numpy as np

# --------------------------------
# 1.顔ランドマーク検出の前準備
# --------------------------------
# 顔検出ツールの呼び出し
face_detector = dlib.get_frontal_face_detector()

# 顔のランドマーク検出ツールの呼び出し
predictor_path = 'shape_predictor_68_face_landmarks.dat'
face_predictor = dlib.shape_predictor(predictor_path)

images = glob.glob('./faces/*.jpg')
images = sorted(images)[:100]

face_landmarks = []
face_filepaths = []

for filepath in images:
    # 検出対象の画像の呼び込み
    img = face_recognition.load_image_file(filepath)

    face_encodings = face_recognition.face_encodings(img)
    if (len(face_encodings)>0):
        face_filepaths.append(filepath)
        face_landmarks.append(face_encodings[0])

pca = PCA(n_components=20)
pca.fit(face_landmarks)

# 分析結果を元にデータセットを主成分に変換する
transformed = pca.fit_transform(face_landmarks)

# 主成分をプロットする
# plt.subplot(1, 2, 2)
plt.scatter(transformed[:, 0], transformed[:, 1])
plt.title('principal component')
plt.xlabel('pc1')
plt.ylabel('pc2')

# 主成分の次元ごとの寄与率を出力する
print(pca.explained_variance_ratio_)
print(sum(pca.explained_variance_ratio_))

# print(transformed[0])
# print(len(transformed[0]))

# Kmeans開始
# クラスター数
K = 8
cls = KMeans(n_clusters = 8)
pred = cls.fit_predict(transformed)

# 各要素をラベルごとに色付けして表示する
for i in range(K):
    labels = transformed[pred == i]
    plt.scatter(labels[:, 0], labels[:, 1])

# クラスタのセントロイド (重心) を描く
centers = cls.cluster_centers_
plt.scatter(centers[:, 0], centers[:, 1], s=100,
            facecolors='none', edgecolors='black')

# どの重心に一番近いかを検索
min_center_distance = -1
min_center_k = 0

# どの重心に一番遠いかを検索
max_center_distance = -1
max_center_k = 0

for center_index in range(K):
    distance = np.linalg.norm(transformed[0] - centers[center_index])
    if ( distance < min_center_distance or min_center_distance == -1):
        min_center_distance = distance
        min_center_k = center_index
    if ( distance > max_center_distance or max_center_distance == -1):
        max_center_distance = distance
        max_center_k = center_index

# 一番近いクラスタと一番遠いクラスタの画像名を表示
print('=========== NEAREST ==============')
for i in range(len(pred)):
    if ( min_center_k == pred[i] ):
        print(face_filepaths[i])
print('=========== FARTHEST ==============')
for i in range(len(pred)):
    if ( max_center_k == pred[i] ):
        print(face_filepaths[i])
print('=========================')

# グラフを表示する
plt.show()


# ※これ以下は蛇足
# 各画像との直接的な距離を算出する
distance = {}
for index in range(len(transformed)):
    distance[face_filepaths[index]] = np.linalg.norm(transformed[0] - transformed[index])

# 距離順にソートして表示
print(sorted(distance.items(), key=lambda x:x[1]))
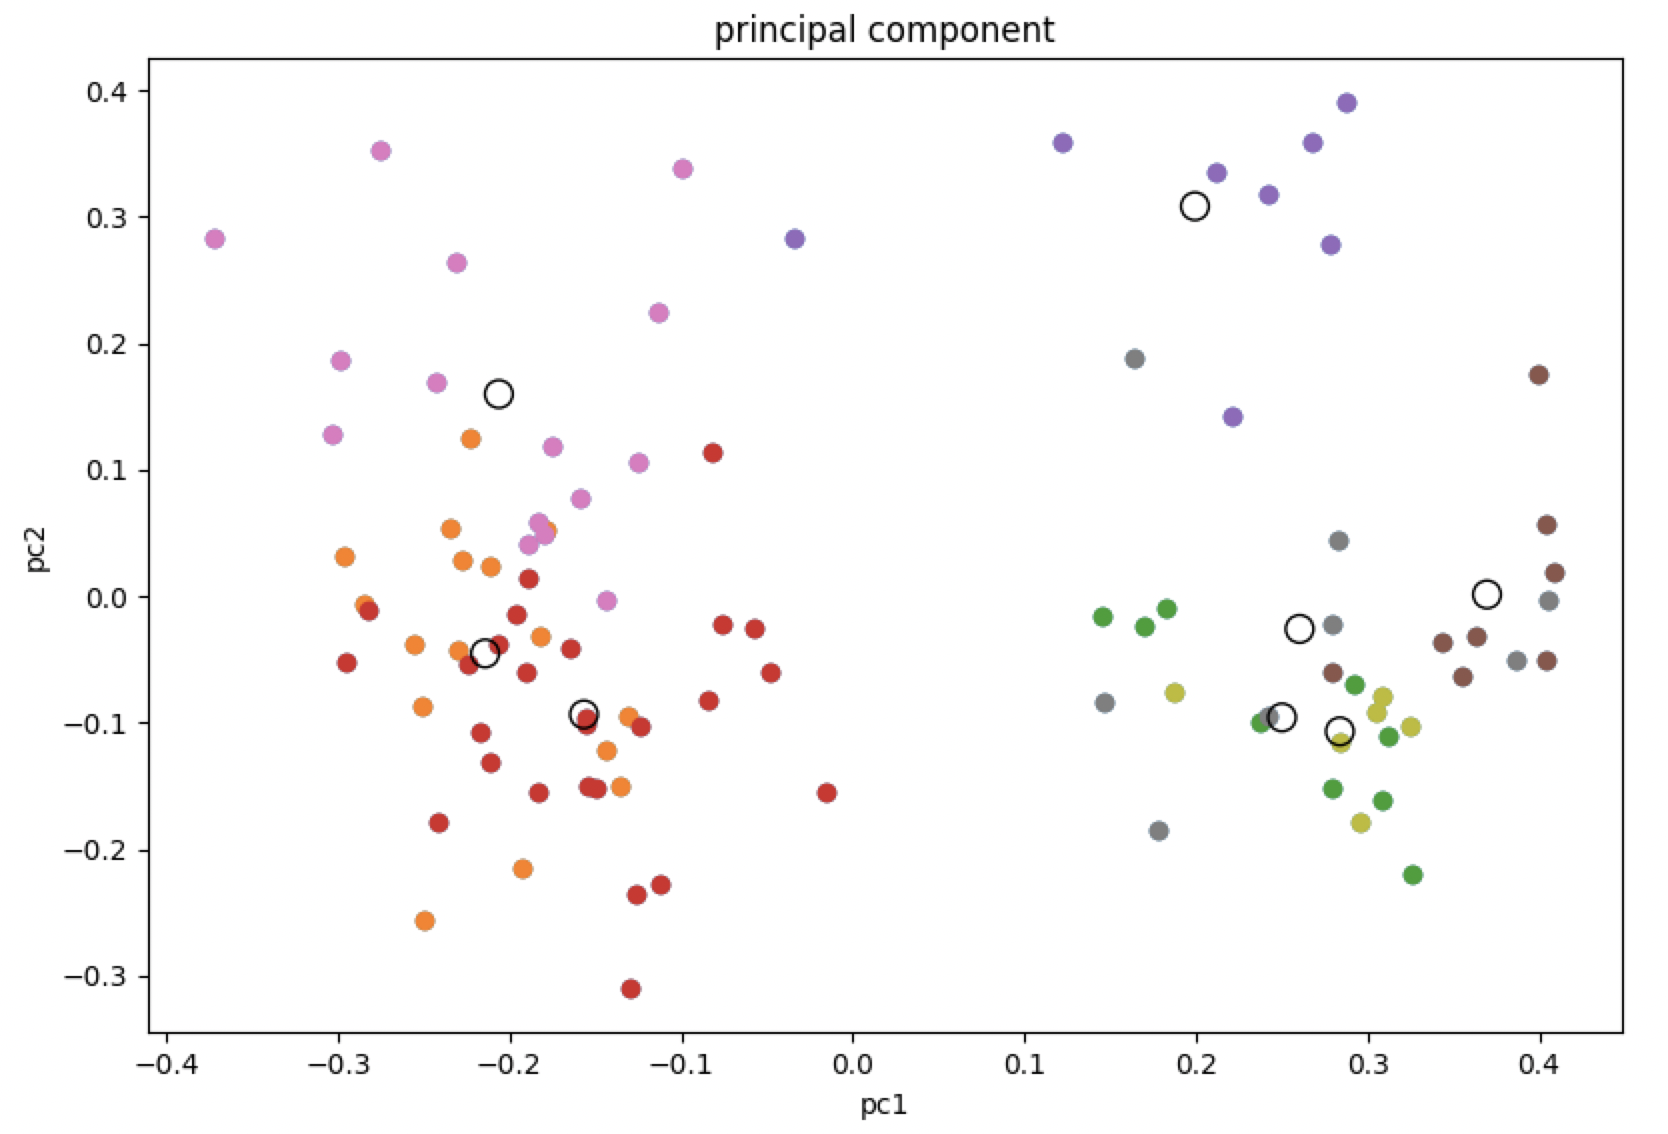
クラスタリング結果グラフ
重心を空洞の円で各クラスタに分けられた画像の特徴を色分けして表示しています。
20次元のグラフを2次元にプロットしているので少し分かりにくいですが、主成分である程度近いもの同士をまとめてクラスタリングしていることがわかります。

分析結果
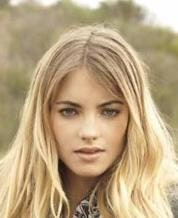
分析のベースにした画像
| 1.jpg |
|---|
 |
同じクラスタに含まれていた画像
| 10.jpg | 11.jpg | 19.jpg | 24.jpg |
|---|---|---|---|
 |
 |
 |
 |
重心が一番遠いクラスタに含まれていた画像
| 12.jpg | 37.jpg | 51.jpg | 60.jpg |
|---|---|---|---|
 |
 |
 |
 |
結果考察
同じクラスタに分けられた画像は長髪の女性が多く、一番遠いクラスタに分けられた画像は短髪の男性が多く、人間の感覚と似たようなクラスタリングができたと思います。
より厳密に近い画像を得たい場合は、主成分分析をせずに直接ノルムを全画像と算出をするべきですが、セレンディピティを狙ったり、より早い計算を実現するためには今回用いいたような手法を検討しても良さそうです。