はじめに
先日Rを使って綺麗なグラフを描けることを知ったのでシェアします。
使ったデータはこちら↓
https://github.com/rfordatascience/tidytuesday
色んなデータがあるので、データで遊んでみたい人はぜひ使ってみてください!
今回作ったもの
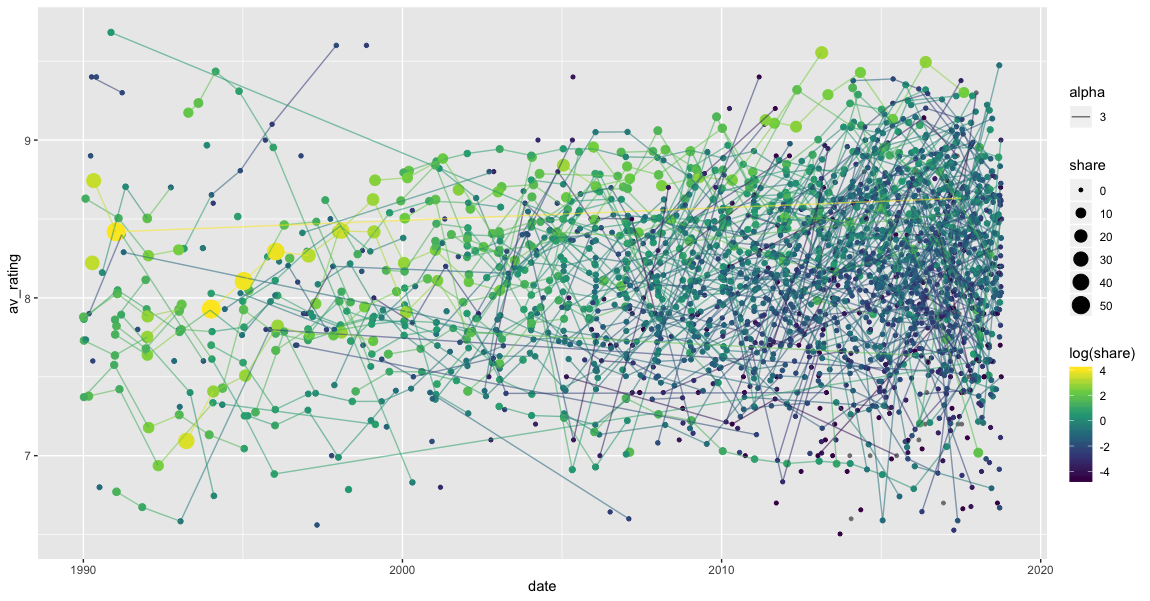
今回は2019-01-08「IMDbが発表した1990年〜2018年のテレビ番組の評価」を使用しました。
どれ程評価があったのかを点の大きさで示し、テレビ番組のシリーズで点を繋げてみました。
これだとあまりggplot2のすごさが伝わっていない気がします…。

tidytuesdayのデータを使って他の皆さんが作ったものの方が凄いのでこちらを見てみてください↓
https://mobile.twitter.com/hashtag/tidytuesday%21?lang=en
やり方
①tidyverseがライブラリに存在するか確認
tidyverseがなければエラーが出るので、install.packages("tidyverse")でインストールします。
library(tidyverse)
これでggplot2が使えるようになります。
②データをRStudioに読み込む
githubから自分のパソコンにクローンしてからデータを読み込む。
setwd("~/research/tidytuesday/data/2019/2019-01-08")
library(readr)
IMDb_Economist_tv_ratings <- read_csv("IMDb_Economist_tv_ratings.csv")
View(IMDb_Economist_tv_ratings)
③グラフを作る
今回作ったグラフは下記のコマンドで作成できます。
ggplot(IMDb_Economist_tv_ratings %>% filter(av_rating>6.5), aes(date, av_rating, col=log(share))) + geom_point(aes(size=share)) + geom_path(aes(group=title, alpha=3)) + scale_color_viridis_c()
感想
ggplot2にはまだまだ面白そうな機能があるので遊んでみたいです。
参考Webサイト
ggplot2の使い方
https://rstudio.com/wp-content/uploads/2015/03/ggplot2-cheatsheet.pdf