この記事は intimatemerger Advent Calendar 2023 の 20日目の記事です。
はじめに
はじめまして。
株式会社インティメート・マージャー開発本部でエンジニアをしています、 @april418 です。
弊社では多くのデータを扱っています。
そのデータを活かすために昨今では生成AIの活用なども行っていますが、人の目で見て判断できるようにすることも大切です。
そのため、弊社の IM-DMP という製品では、グラフなどを用いてデータを可視化する機能を提供しています。
IM-DMP では React ベースのグラフ表示ライブラリ Recharts を使用しています。
レスポンシブ対応や幅広い種類のグラフに対応しているなど、非常に素晴らしいライブラリです。
しかし、日本語のラベルだと自動改行がうまくいかず、ラベルが見切れてしまう問題が発生しました。
これを解決していきたいというのが今回の内容になります。
それでは本題に行ってみましょう!
TL;DR
- ラベルの文字数からざっくりラベルの要素サイズを算出
- 全角と半角を考慮に入れるのがミソ
- フォントによって実際のサイズとはズレがあるのでそのあたりは調整が必要かも
- 計算したサイズを
XAxisYAxisに設定
問題の事象
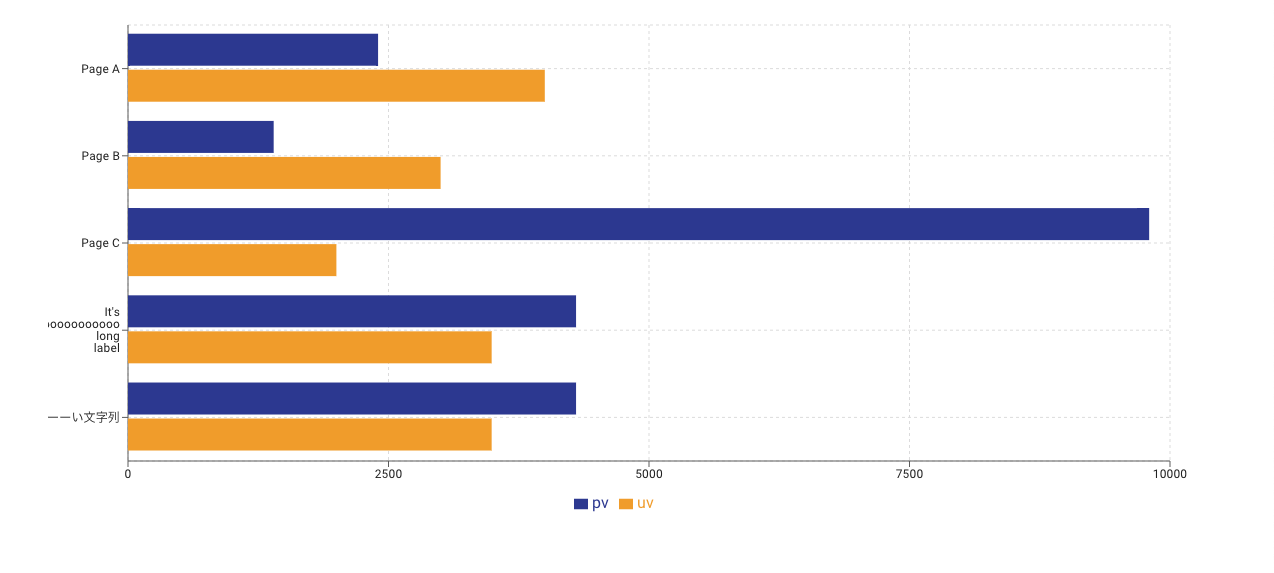
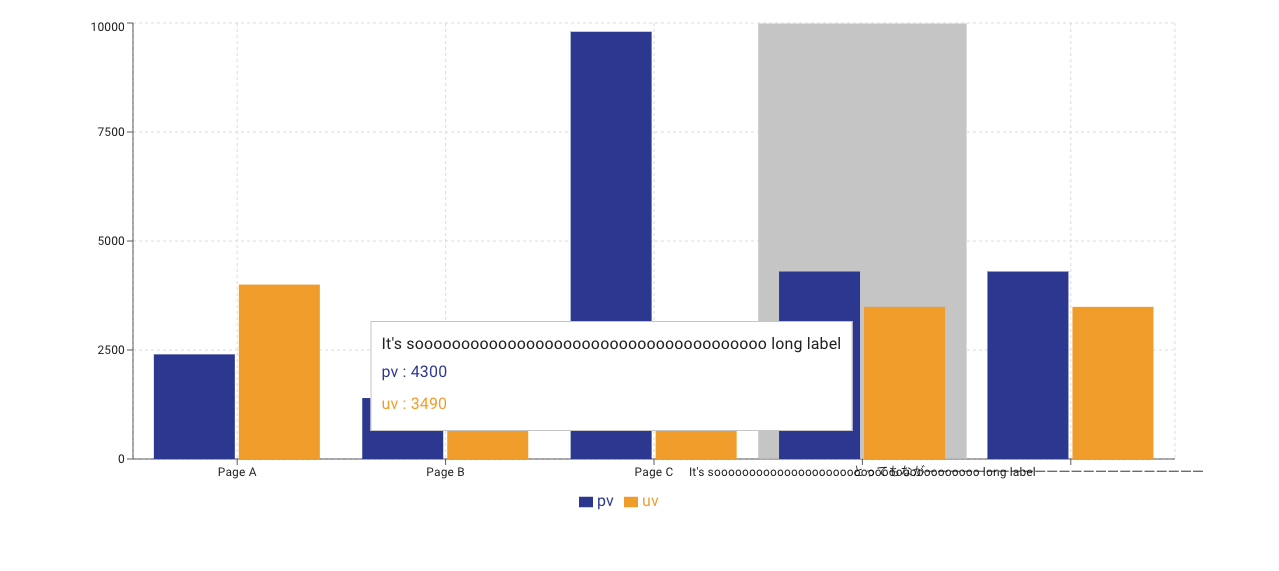
長い文字列がラベルとして入ってきた際に以下のようになってしまいます。
縦棒グラフだともっとひどいことに…。
解決法
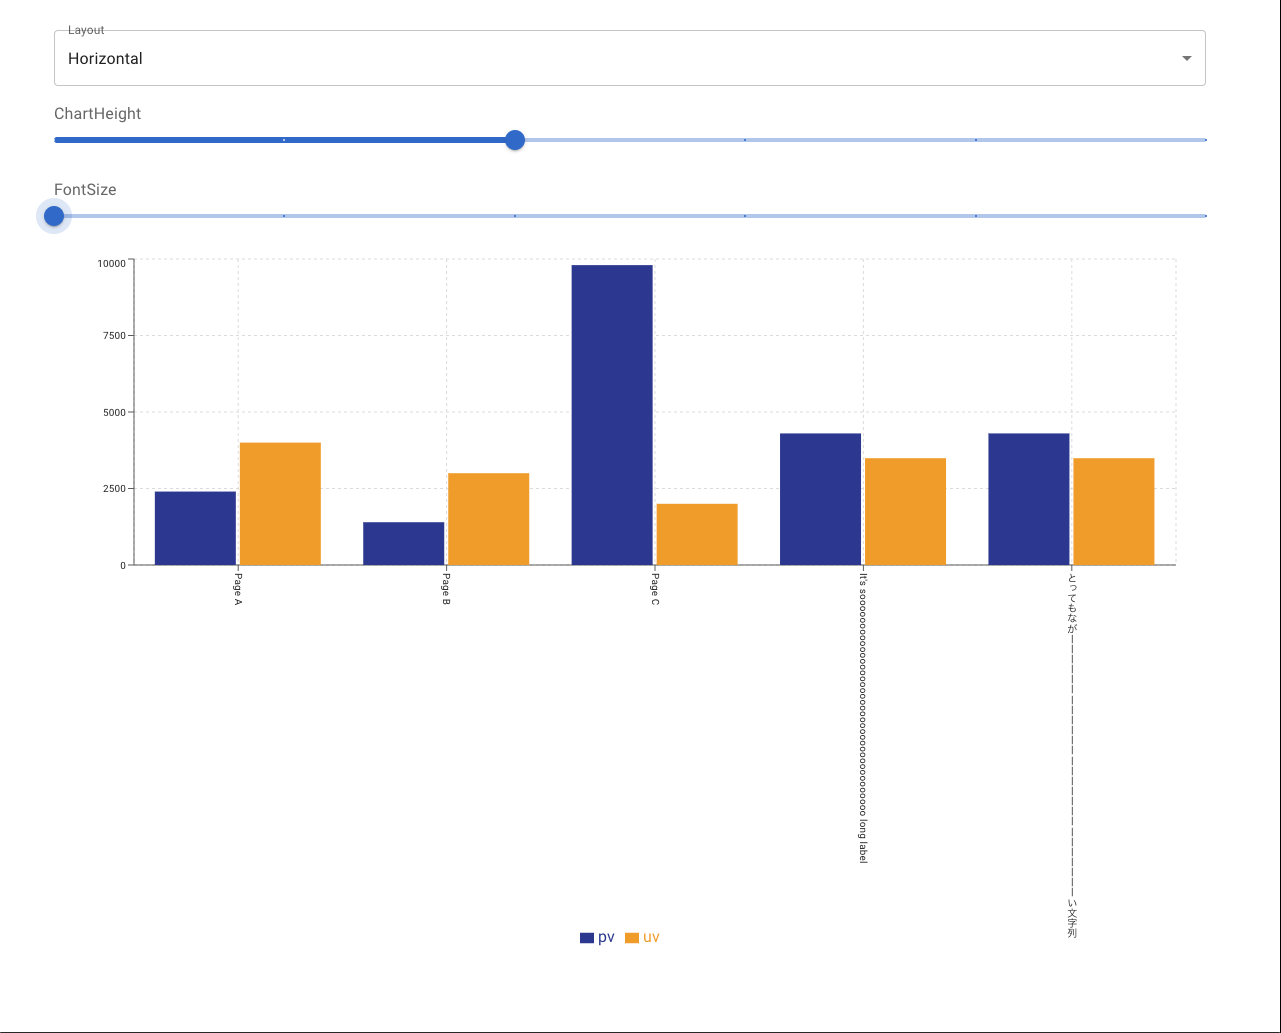
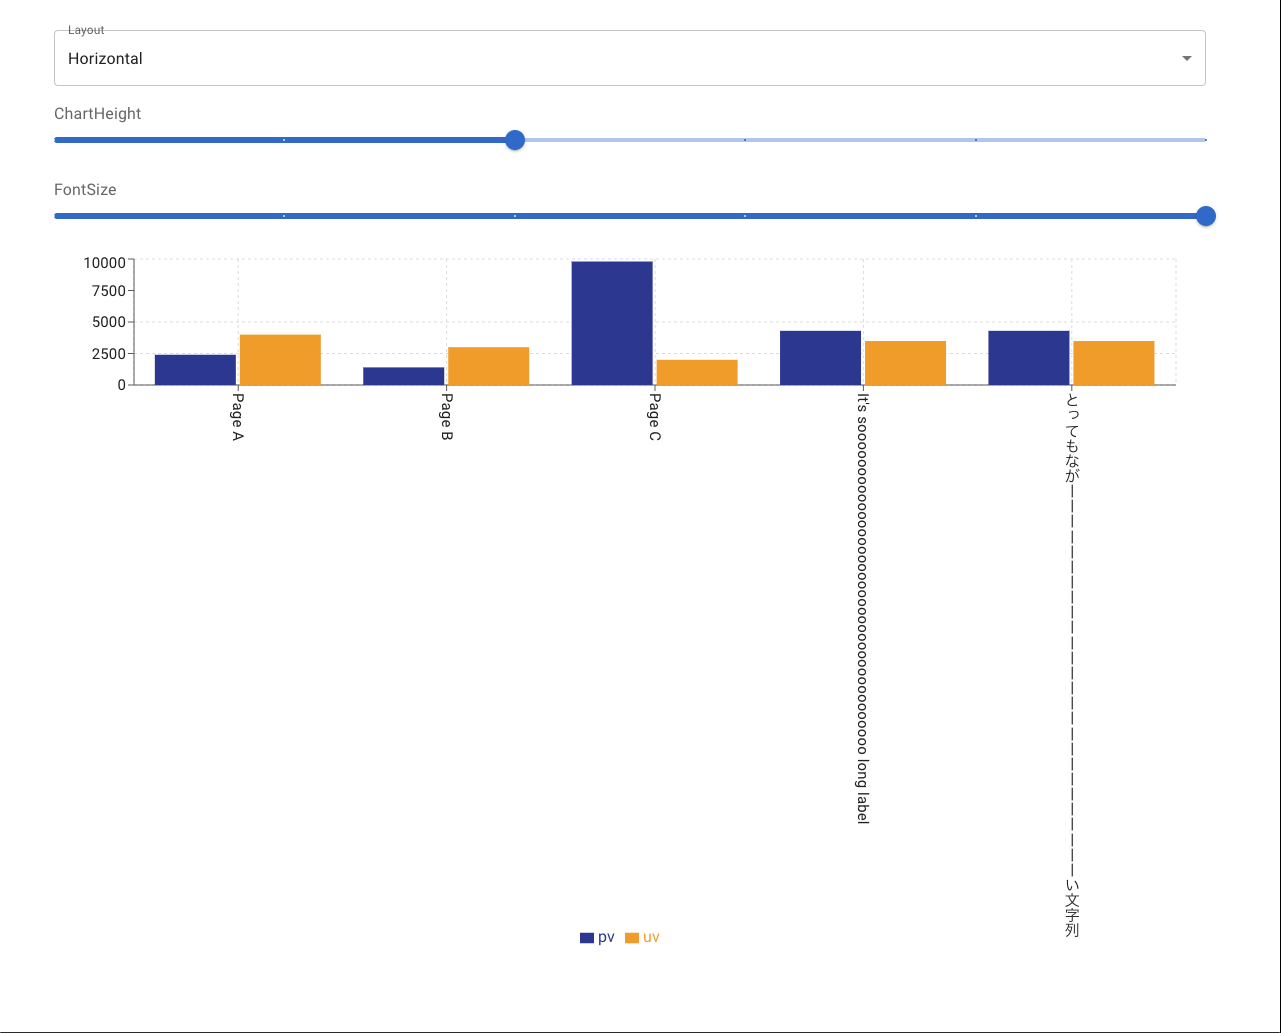
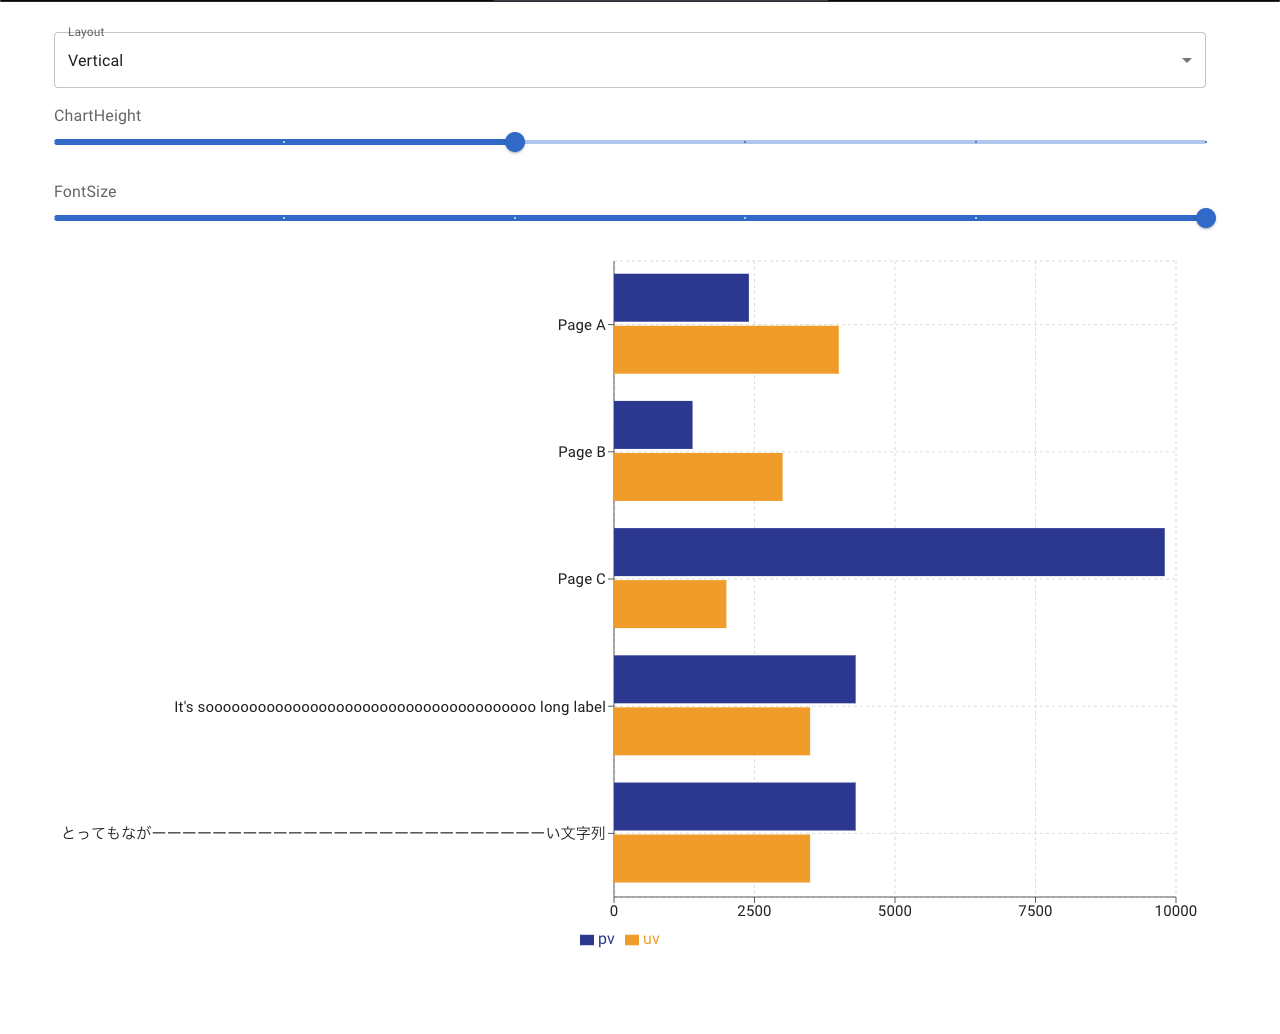
上記の対策を施して出来たサンプルがこちらになります。
(CodePen にて実装しています)
こんな感じでフォントサイズを変更してもラベルが見切れないようになっています。
横棒グラフでも大丈夫です。
実装のポイント
ラベルのサイズを計算する
Recharts の軸ラベルは XAxis YAxis というコンテナと、 その中の Tick というラベルで構成されています。
本来ラベルのサイズを計算するには、レンダリングされた後にラベルのサイズを取得するのが最も正確です。
ですが、この方法は一度レンダリングした後にコンテナサイズを再計算して再レンダリングを行うため、パフォーマンス的な懸念があります。
そのため、今回はラベルの文字列の長さから簡易的なラベルサイズを割り出し、そのサイズをコンテナに設定することにしました。
初めは 文字列の長さ * フォントサイズ のような形で計算していたのですが、当然全角文字と半角文字でかなりの誤差が生じてしまうので、正規表現で全角半角を判定して半角文字なら半分のサイズで計算するようにしました。
/**
 * 半角文字かどうかを判定します
 * @param {string} char - 判定する文字
 * @return {boolean} 半角文字の場合はtrue、それ以外の場合はfalse
 */
const isHankaku = (char: string) => {
  return /[\x01-\x7E]|[\uFF65-\uFF9F]/.test(char);
};

/**
 * 全角文字かどうかを判定します
 * @param {string} char - 判定する文字
 * @return {boolean} 全角文字の場合はtrue、それ以外の場合はfalse
 */
const isZenkaku = (char: string) => {
  return !isHankaku(char);
};

/**
 * 文字列中の半角文字の数をカウントします
 * @param {string} str - カウントする文字列
 * @return {number} 半角文字の数
 */
const countHankaku = (str: string) => {
  return [...str].filter(isHankaku).length;
};

/**
 * 文字列中の全角文字の数をカウントします
 * @param {string} str - カウントする文字列
 * @return {number} 全角文字の数
 */
const countZenkaku = (str: string) => {
  return [...str].filter(isZenkaku).length;
};

/**
 * 文字列の長さを計算します
 * @param {string} str - 長さを計算する文字列
 * @param {number} charLen - 全角文字の長さ(デフォルトは12)
 * @return {number} 計算された文字列の長さ
 */
const calclateStringLength = (str: string, charLen = 12) => {
  return (countHankaku(str) / 2 + countZenkaku(str)) * charLen;
};
グラフのレイアウトに応じて計算したラベルのサイズを設定する
カテゴリが縦に並ぶレイアウト ( layout="vertical" ) の場合はコンテナ要素である YAxis の width に先ほど計算した文字列の長さを設定するだけです。
しかし、カテゴリが横に並ぶレイアウト ( layout="horizontal" ) の場合はラベルが長すぎて他のラベルと被ってしまいます。
そのため、 XAxis の tick にカスタムコンポーネントを設定してラベルを縦書きに変更し、コンテナ要素の XAxis の height に計算した文字列の長さを設定しています。
( 見た目を整えるのに Material UI を併せて使用しています )
/**
 * 棒グラフの軸ラベルのプロパティ
 */
type CustomBarChartTickProps = {
  x?: number;
  y?: number;
  stroke?: string;
  fontSize?: number;
  writingMode?: "horizontal-tb" | "vertical-rl" | "vertical-lr";
  payload?: any;
};

/**
 * 棒グラフの軸ラベル
 * 縦書きにしたいので writingMode を設定できるようにしています
 */
const CustomBarChartTick: React.FC<CustomBarChartTickProps> = (props) => {
  const { x, y, stroke, fontSize, writingMode, payload } = props;
  const { value } = payload;

  return (
    <text
      x={x}
      y={y}
      fill={stroke}
      fontSize={fontSize}
      writingMode={writingMode}
    >
      <tspan>{value}</tspan>
    </text>
  );
};

/**
 * 棒グラフのデータ型
 */
type CustomBarChartData = {
  name: string;
  uv: number;
  pv: number;
  amt: number;
};

/**
 * 棒グラフのプロパティ
 */
type CustomBarChartProps = {
  layout: LayoutType;
  height: number;
  data: CustomBarChartData[];
  axisFontSize?: number;
};

/**
 * フォントサイズに応じてラベルのコンテナサイズを調整できる棒グラフ
 */
const CustomBarChart: React.FC<CustomBarChartProps> = (props) => {
  const theme = useTheme();
  const { layout, height, data, axisFontSize } = props;
  const axisSize = Math.max(
    ...data.map((d) => calclateStringLength(d.name, axisFontSize))
  );

  return (
    <ResponsiveContainer width="100%" height={height}>
      <BarChart
        layout={layout}
        data={data}
        margin={{
          top: 5,
          right: 30,
          left: 20,
          bottom: 5
        }}
      >
        <CartesianGrid stroke={theme.palette.grey[300]} strokeDasharray="3 3" />
        {layout === "horizontal" ? (
          <>
            <XAxis
              type="category"
              dataKey="name"
              interval={0}
              height={axisSize}
              tick={
                <CustomBarChartTick
                  stroke={theme.palette.text.primary}
                  fontSize={axisFontSize}
                  writingMode="vertical-rl"
                />
              }
            />
            <YAxis
              type="number"
              tick={{
                fontSize: axisFontSize,
                fill: theme.palette.text.primary
              }}
            />
          </>
        ) : (
          <>
            <XAxis
              type="number"
              tick={{
                fontSize: axisFontSize,
                fill: theme.palette.text.primary
              }}
            />
            <YAxis
              type="category"
              dataKey="name"
              interval={0}
              width={axisSize}
              tick={{
                fontSize: axisFontSize,
                fill: theme.palette.text.primary
              }}
            />
          </>
        )}
        <Tooltip />
        <Legend />
        <Bar dataKey="pv" fill={indigo[700]} />
        <Bar dataKey="uv" fill={amber[700]} />
      </BarChart>
    </ResponsiveContainer>
  );
};
おわりに
読んでいただきありがとうございました。
あまりキレイな実装方法ではないですが、皆さんの参考になりましたら幸いです。
次回は @Jumons さんの「GCPの権限昇格の話」です! お楽しみに!
