を興味深く読んだのですが、コード例がMATPLOTLABなのでPython化してみました。
以下、Google Colaboratoryで実施しています
p.16 ピタゴラス勝率
- 元のコード
!pip -q install japanize_matplotlib

import pandas as pd

import statsmodels.api as sm

import matplotlib.pyplot as plt
import japanize_matplotlib
import seaborn as sns

df = pd.read_excel('pythagoreanWP.xlsx')
df = df.rename(columns={'Unnamed: 0': '年', 'Unnamed: 1': 'リーグ'})
df.head()
データフレームの確認略
plotX = df['得点']**2 / (df['得点']**2 + df['失点']**2)
plotY = df['率']

x = plotX
y = plotY

x = sm.add_constant(x)
model = sm.OLS(y, x).fit()
#print(model.summary()) # 回帰の結果確認用

sns.scatterplot(x=plotX, y=plotY, hue=df['リーグ'], style=df['リーグ'], markers=['o', 's'])
plt.axline((0.3, 0.3), (0.7, 0.7), linestyle='--', color='red')
sns.regplot(x=plotX, y=plotY, scatter=False)

plt.text(0.5, 0.35, '自由度調整済み決定係数={:.3f}'.format(model.rsquared_adj))
plt.xlim(0.3, 0.7)
plt.ylim(0.3, 0.7)
plt.title('NPB, 2013年-2022年')
plt.xlabel('ピタゴラス勝率')
plt.ylabel('実勝率')

plt.show()
- 補足
- 元の図には回帰直線はありませんが追加しました
- 元の図には回帰係数とありますが、コードを見ると相関係数のようです。こちらでは自由度調整済み決定係数を表示しています
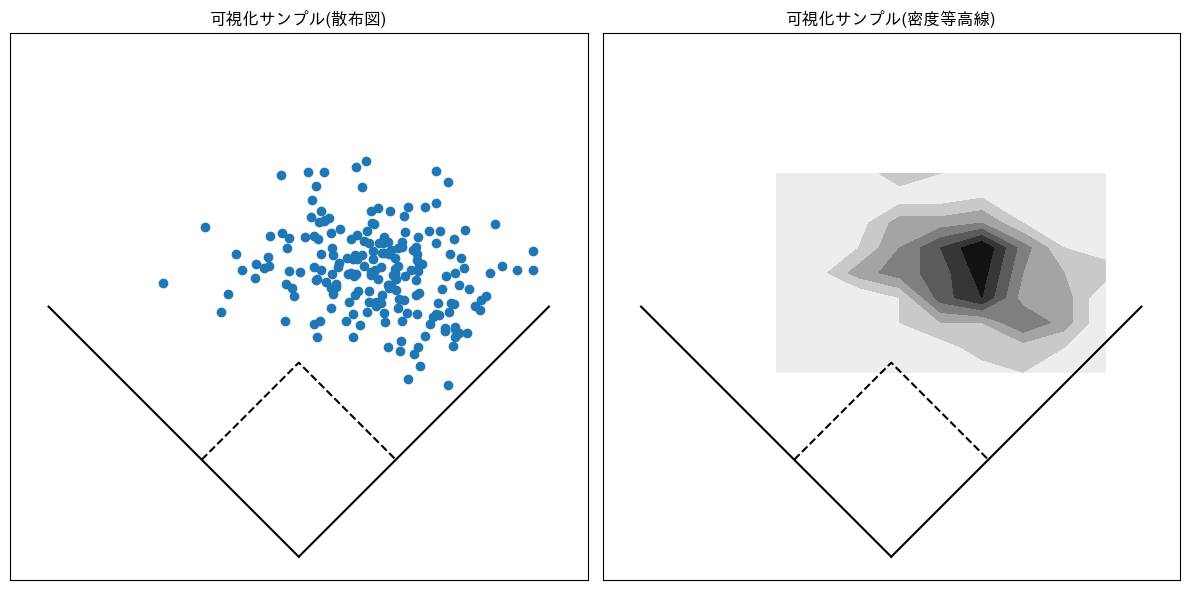
p.32 可視化サンプル(打球位置)
- 元のコード
import numpy as np
import matplotlib.pyplot as plt

# 乱数のシードを設定(括弧の中の値を変えると乱数も変わります)
np.random.seed(2)

# データポイントの数
N = 200

# 角度thを生成
th = (np.random.randn(N) * 0.3 + np.pi / 5 + (np.random.randn(N) * 0.3 + np.pi / 8)) / 2

# 半径Rを生成
R = np.random.randn(N) * 8 - 2 * (th - np.pi / 6) ** 2 + 62

# xとyの座標を計算
x = R * np.cos(th)
y = R * np.sin(th)

# 回転行列を適用
rotation_angle = np.pi / 4
rotation_matrix = np.array([
    [np.cos(rotation_angle), -np.sin(rotation_angle)],
    [np.sin(rotation_angle),  np.cos(rotation_angle)]
])
x_y = np.vstack((x, y))
xNew = rotation_matrix @ x_y
xNew = xNew.T  # N x 2の配列に変換

# 図とサブプロットを作成
fig, axs = plt.subplots(1, 2, figsize=(12, 6))

# サブプロット1: 散布図
ax = axs[0]
ax.scatter(xNew[:, 0], xNew[:, 1])
ax.axis('equal')
ax.set_xlim(-50, 50)
ax.set_ylim(0, 100)
ax.set_xticks([])
ax.set_yticks([])

# ラインをプロット
ax.plot([0, 50], [0, 50], 'k-')
ax.plot([-50, 0], [50, 0], 'k-')
ax.plot(
    27.431 * np.sin(np.pi / 4) * np.array([-1, 0, 1]),
    27.431 * np.cos(np.pi / 4) * np.array([1, 2, 1]),
    'k--'
)

# タイトルを設定
ax.set_title('可視化サンプル(散布図)')

# サブプロット2: 密度等高線
ax = axs[1]

# 2Dヒストグラムを計算
hist2d_counts, xedges, yedges = np.histogram2d(xNew[:, 0], xNew[:, 1], bins=9)

# ビンの中心を計算
xcenters = (xedges[:-1] + xedges[1:]) / 2
ycenters = (yedges[:-1] + yedges[1:]) / 2
XMesh, YMesh = np.meshgrid(xcenters, ycenters)

# 等高線をプロット
contour = ax.contourf(
    XMesh, YMesh, hist2d_counts.T, levels=8, linestyles='none', cmap=plt.cm.gray_r
)

# ラインをプロット
ax.plot([0, 50], [0, 50], 'k-')
ax.axis('equal')
ax.set_xlim(-50, 50)
ax.set_ylim(0, 100)
ax.set_xticks([])
ax.set_yticks([])

ax.plot([-50, 0], [50, 0], 'k-')
ax.plot(
    27.431 * np.sin(np.pi / 4) * np.array([-1, 0, 1]),
    27.431 * np.cos(np.pi / 4) * np.array([1, 2, 1]),
    'k--'
)

# タイトルを設定
ax.set_title('可視化サンプル(密度等高線)')

# レイアウトを調整して図を保存
plt.tight_layout()
#plt.savefig('visualizationSample.pdf')
plt.show()
p.36 MLBのホームラン数
import pandas as pd
import matplotlib.pyplot as plt
import japanize_matplotlib

df = pd.read_excel('MLB_HomeRuns.xlsx')
df.head()
df_AL = pd.read_excel('sportsref_download AL.xls')
df_AL.head()
df_NL = pd.read_excel('sportsref_download NL.xls')
df_NL.head()
df = df.dropna()

plt.scatter(df['Year'], df['A.L. + N.L.'], facecolor='None', edgecolors='blue')

plt.plot(df['Year'], df['A.L. + N.L.'])
plt.grid()
plt.xlabel('年')
plt.ylabel('総ホームラン数')
plt.show()
df_AL = df_AL[df_AL['Year'] >= 1998]
df_NL = df_NL[df_NL['Year'] >= 1998]

plt.figure(figsize=(8,3))
plt.scatter(df_AL['Year'], df_AL['HR'] / df_AL['PA'], marker=',', facecolor='None', edgecolors='blue', label='AL')
plt.plot(df_AL['Year'], df_AL['HR'] / df_AL['PA'])
plt.scatter(df_NL['Year'], df_NL['HR'] / df_NL['PA'], facecolor='None', edgecolors='orange', label='NL')
plt.plot(df_NL['Year'], df_NL['HR'] / df_NL['PA'])
plt.grid()
plt.xlabel('年')
plt.ylabel('1打席当たりの本塁打数')
plt.legend()
plt.show()


