Qiita初投稿!!新卒1年目エンジニアのやすです(´▽`)
参考サイト:[changefinder]
(http://argmax.jp/index.php?changefinder)
※使い方はすべてこちらのリンク先に載っています。
背景
「PVが急上昇しているかを知りたい!」という声を最近耳にし、やってみました。
そうというときは、変化点検出、外れ値検出を用いて計測するのが多いみたいです。
調べてるうちにchangefinderというモデルが使われている例がいくつかありました。
[「Ameba」と「Twitter」を用いた急上昇ワードの特定手法とシステムの紹介]
(https://www.cyberagent.co.jp/techinfo/techreport/report/id=9749)
RやPythonでパッケージがあるので、今回は触ったことのないpythonのパッケージのサンプルコードを試しました!
R: [異常検知(変化点検出)のパッケージを作ってみた]
(http://d.hatena.ne.jp/yokkuns/20120930/1348978641)
Python: [changefinder]
(http://argmax.jp/index.php?changefinder)
実践
エディタは最近Python界隈で話題のjupyterを使いました。
jupyter nootbookのインストール方法はこちらにまとまっています。
jupyterはインタラクティブにコード修正、データ取得、プロットができるおすすめのエディタです。
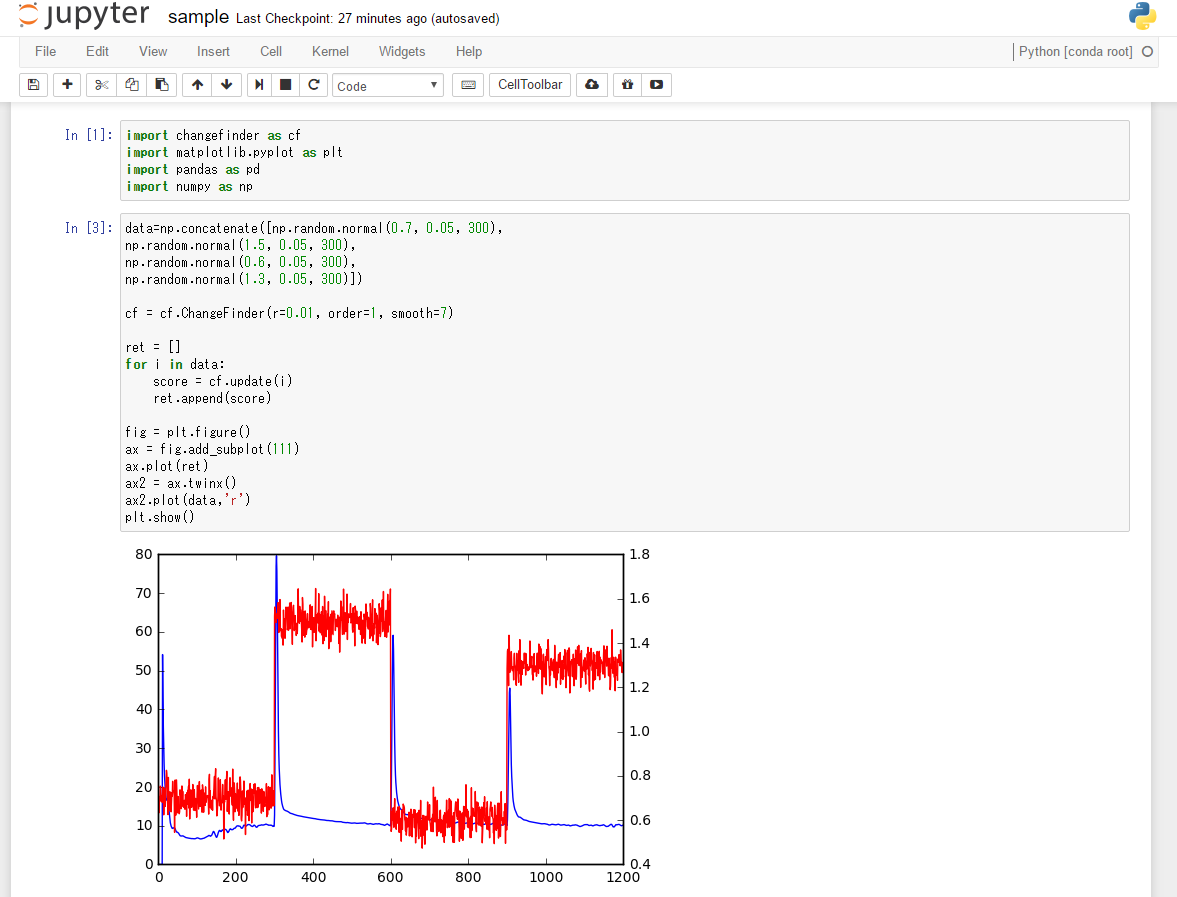
jupyterでサンプルコードを叩くと、こんな感じになります
まずはchangefinderのパッケージのインストール
必要なライブラリをインストール
pip install changefinder
matplotlib.pyplotは、グラフプロットの標準的なライブラリです。
numpyは、乱数などを生む関数が色々は言っている便利なライブラリです。
pandasは、データフレームなどといった、データ操作が便利になる型などが入っております。
import changefinder as cf
import matplotlib.pyplot as plt
import pandas as pd
import numpy as np
分析対象のデータを作成します。平均値が低、高、低、高の乱数を作成し、格納しています。
data=np.concatenate([
np.random.normal(0.7, 0.05, 300),
np.random.normal(1.5, 0.05, 300),
np.random.normal(0.6, 0.05, 300),
np.random.normal(1.3, 0.05, 300)])
パラメーターをセットします。
cf = changefinder.ChangeFinder(r=0.01, order=1, smooth=100)
スコアを配列に入れて
ret = []
for i in data:
    score = cf.update(i)
    ret.append(score)
グラフプロットです。
fig = plt.figure()
ax = fig.add_subplot(111)
ax.plot(ret)
ax2 = ax.twinx()
ax2.plot(data,'r')
plt.show()
まとめ
jupyterだと、インタラクティブにできるので、簡単に色々なパッケージを試せます!