In this article, I will talk about various software tools which I use regularly to boost up my work quality. I am a Data Scientist and I usually handle Computer Vision problems that our clients at ABEJA are facing. I have a total experience of more than 7 years in the Software industry and I find myself lucky to have varied experience with many tools in the frontend, backend and infra side of software development. I keep using them along with my Data Science work to ease, automate, visualize and report things. Knowing these tools liberate you from restrictions of experimenting with ideas and presenting a prototype of your ideas to the stake-holders. It helps you to understand the problem at hand better and judge your models' results more intuitively and visually.
Enough of the warmup, let's jump to the use cases:
- Having a short use long running script to run on a server
- Having a service which need to run reliably
- Having a script to be run regularly at a specific time or time intervals
- My dataset/task is unconventional and it's hard to convey my thoughts
- Other Tips (talks about Google Colab, Bokeh, Flask, Scraping)
For brevity, I will only be touching the surface for the tools mentioned. There are a lot of additional features and it is recommended to slowly get familiar with them. I hope this blog will make you comfortable to give them a try.
Having a short use long running script to run on a server
A very common scenario we face every day. A few examples are downloading many images, transforming data from one format to another and inferring your model on big data.
The direct way is to run the script on the terminal and wait for it to execute. The problem is as soon as you close the terminal, the shell session will end killing the process. There are many cloud tools like running lambdas, Dataflow, Dataproc, AI Platform jobs etc. which are great for scripts that need to run frequently. But for simple scenarios like one-time data transformation, it might be overkill to transform your python script to use these tools.
An easy way is using tmux. It's an open-source terminal multiplexer. More simply said, you can run a background terminal session which can run as long as your server is running, even when no active user shell sessions are there. The good thing is it works on any Unix-like operating system, so should be quite easy to start with on Linux or Mac OS (even possible on Windows 10 onwards). To see how amazing it is, why not have a quick hands-on:
Let's assume we have a hypothetical task to run a long background job that changes a filename every second:
-
Open the terminal
-
Write a python script
change_filename.pythat we want to run:change_filename.pyimport time from pathlib import Path i = 0 Path(f"test_file_{i}.txt").touch() while True: i += 1 time.sleep(1) my_file = Path(f"test_file_{i-1}.txt") my_file.rename(f"test_file_{i}.txt") -
Run the script:
python change_filename.py
You will notice that the file name is changing. Now close the terminal and you will notice it will stop changing in some time as the process is killed. Now let's try tmux.
- Install tmux:
sudo apt-get install tmuxfor Linux andbrew install tmuxfor mac. - Create a tmux session:
tmux new -s demo - You will now see another terminal opened on top of your existing terminal session. This is a background tmux session which you can get out using
Ctrl+b(keeps the session running in the background) or executingexiton the shell (terminates the session). You can come back to an ongoing session by runningtmux a -t demo. - Now let's run the same command again inside this tmux session using
python change_filename.py.
You will see the name is still updating. Now you can even close the terminal application and the script should still be running. Same way even if you disconnect from your remote server, your scripts will be running.
A list of useful commands:
- List all sessions: tmux ls
- Create new session: tmux new -s {session_name}
- Attach to an existing session: tmux a -t {session_name}
- Detach from session: First press "Ctrl+b" and then press "d"
- Scroll through session logs: First press "Ctrl+b" and then press "["
- Getting out of scrolling mode: Escape button
- Kill session: running "exit" command in session OR tmux kill-session -t {session_name}
- View all sessions: Ctrl + w
This is the bare minimum usage guide, but tmux can do a lot more. The reason it's given a fancy name "terminal multiplexer" is that one can also create windows and panes inside a session to run multiple commands running visually next to each other without a need to switch tabs (imaging one page to show CPU usage, one for GPU usage, one for your training script logs, etc.). You can quickly make a nice dashboard of live running script using a bunch of shortcuts tmux provides (check them here).
Having a service which need to run reliably
This is usually a case when you're hosting a server, let's say model APIs or live inferencing from cameras on a Jetson Device. Tmux in this case might not be reliable as it doesn't have key features like auto-restart on failures, auto start when the machine starts. One good way to deal with this is registering it as a system service. For this, we can use systemd which is a system and service manager for Linux operating systems. We will use systemctl commands to easily interact with systemd.
These commands should directly work on Linux. But for mac, the equivalent tool is 'brew services' ![]()
- Create a configuration file for your service
[Unit]
Description=myservice
After=network.target

[Service]
Environment=MY_ENV=staging                               # these environment variables will be available for your service
Environment=LD_LIBRARY_PATH=/usr/local/cuda-10.2/lib64
WorkingDirectory=/srv/myservicerepo                      # the script will run on this directory
User=www-data
ExecStart=python /srv/myservicerepo/app.py               # the script to run. Kindly provide absolute path
ExecReload=/bin/kill -HUP $MAINPID
KillMode=process
IgnoreSIGPIPE=true
Restart=always                                           # systemctl will try restarting the app 3 times on crash
RestartSec=3
Type=simple

[Install]
WantedBy=multi-user.target
Kindly remove the comments (# ...) before trying the above configuration file
- Use following commands to load, start and register this service:
# reload configurations
sudo systemctl daemon-reload

# restart server
sudo systemctl restart hertz.service

# check server status
sudo systemctl status hertz.service

# check logs
sudo journalctl -u hertz.service -f

# enable on boot
sudo systemctl enable hertz.service
You can try the
change_file_name.pyscript from the previous session. Just make sure to give an absolute path for theExecStartcommand. The output file will be written at the path mentioned byWorkingDirectory.
Having a script to be run regularly at a specific time or time intervals
Let's say you want to do a health check of your service every day or you need to run a script to migrate data from one source to another every night. One simple scenario is you need to report the performance of the new data dump you got every day to let's say Slack. How about automating this. It is quite easy to do if you get familiar with an internal OS tool Cron. All you need to do is register your script and time of the day to run.
- Open cron file editor:
crontab -e - Add a line to detail your task:
5 0 * * * $HOME/bin/daily.job >> $HOME/tmp/out 2>&1 - execute
:wqto write and exit
There are 2 parts of the main command. First declares the schedule to run the job and next is the command to run. The schedule has a format of minute hour day of month month day of the week. * means all values, e.g. * for hour means every hour. The above command can be translated to run daily.job command five minutes after midnight, every day. Additionally, we are writing the output to /tmp/out file using the >> operator.
You can find more info here and to validate your command you can use https://crontab.guru/.
My dataset/task is unconventional and it is hard to convey my thoughts
Getting aware of different graphs and plots and using the right one at the right time boosts up your EDA and yours reports to the clients. Get comfortable for all plots provided by Seaborn library. For more creative and interactive visualizations, I will recommend checking Bokeh and D3.js.
If you work on Computer Vision, it is very crucial to visualize your results. I really love the implementation done by Ultralytics repo for Yolov5 (https://github.com/ultralytics/yolov5). They have used Weights and Biases tool to dump various stats during training. It's quite easy to compare experiments and create a report. It takes some time to implement it, but it's totally worth the effort if you're planning to run various experiments.
Another tool I love using for this is Google Sheets + App Script. A simple javascript function can make your report interactive. I seldom create spreadsheets with interactive buttons to interact and visualize raw images, annotations and results of various models I have built. Just relying on evaluation metrics sometimes is not enough and you cannot be confident of your model unless you see it in action. Doing this is quite easy. Here we will fetch and show info about Breaking Bad characters using an open API.
- Create a spreadsheet (https://docs.google.com/spreadsheets/create).
- Go to
Extension->Apps Script. - Add the following function. It get handle of active sheet, calls an API:
function showBreakingBadCharacters() {
  var ss = SpreadsheetApp.getActiveSpreadsheet();                              // get handle to spreadsheet
  var sheet = ss.getActiveSheet();                                             // get handle to active sheet. You can specify sheet by name too using getSheetByName method

  var data = getData('https://www.breakingbadapi.com/api/characters?limit=2'); // getting data from url

  let keys = ["name", "nickname", "status", "img"];                            // these are the fields we will display on the sheet
  for (var i=0; i<data.length; i++) {
    sheet.setRowHeight(i+1, 150);                                              // setting row height as same as image height
    for (let key of keys) {
      if (key=="img") {
        insertImageFromUrl(sheet, data[i][key], i+1, keys.indexOf(key)+1);
        sheet.setColumnWidth(keys.indexOf(key)+1, 150);                       // setting column width as same as image height
      } else
        sheet.getRange(i+1, keys.indexOf(key)+1).setValue(data[i][key]);      // put text on the cell selected by getRange
    }
  }
}

function insertImageFromUrl(sheet, url, row, column) {
  var response = UrlFetchApp.fetch(url);
  var binaryData = response.getContent();
  var imageBlob = Utilities.newBlob(binaryData, 'image/png', 'sample');
  var image = sheet.insertImage(imageBlob, column, row);
  image.setHeight(150);
  image.setWidth(150);
}

function getData(url) {
  var response = UrlFetchApp.fetch(url);                                     // get api endpoint
  var json = response.getContentText();                                      // get the response content as text
  var data = JSON.parse(json);                                               // parse text into json
  return data;
}
- Now click on
Runat the top (make sure the selected function next to it is our entry functionshowBreakingBadCharacters). - This will fetch data from the API and nicely place it on the sheet.
I can't emphasize how powerful and fun it is to use Google App Script. It can enable you to build useful applications which are readily deployed in Google's infrastructure and executed for free and can be shared easily. Adding more UI elements is possible. You can add buttons on the sheet which can call one of the functions from your App Script code. You can even show HTML elements, like showing a popup that can take input from the users. You can schedule your scripts to run regularly at a certain time using Triggers. Make integrations with Slack or the Calendar app. To take it to the next level you can quickly make a data-driven mobile app using Google Appsheet. The sky's the limit. Just make sure you won't start over-engineering (like I did).
Few of the tools I have made:
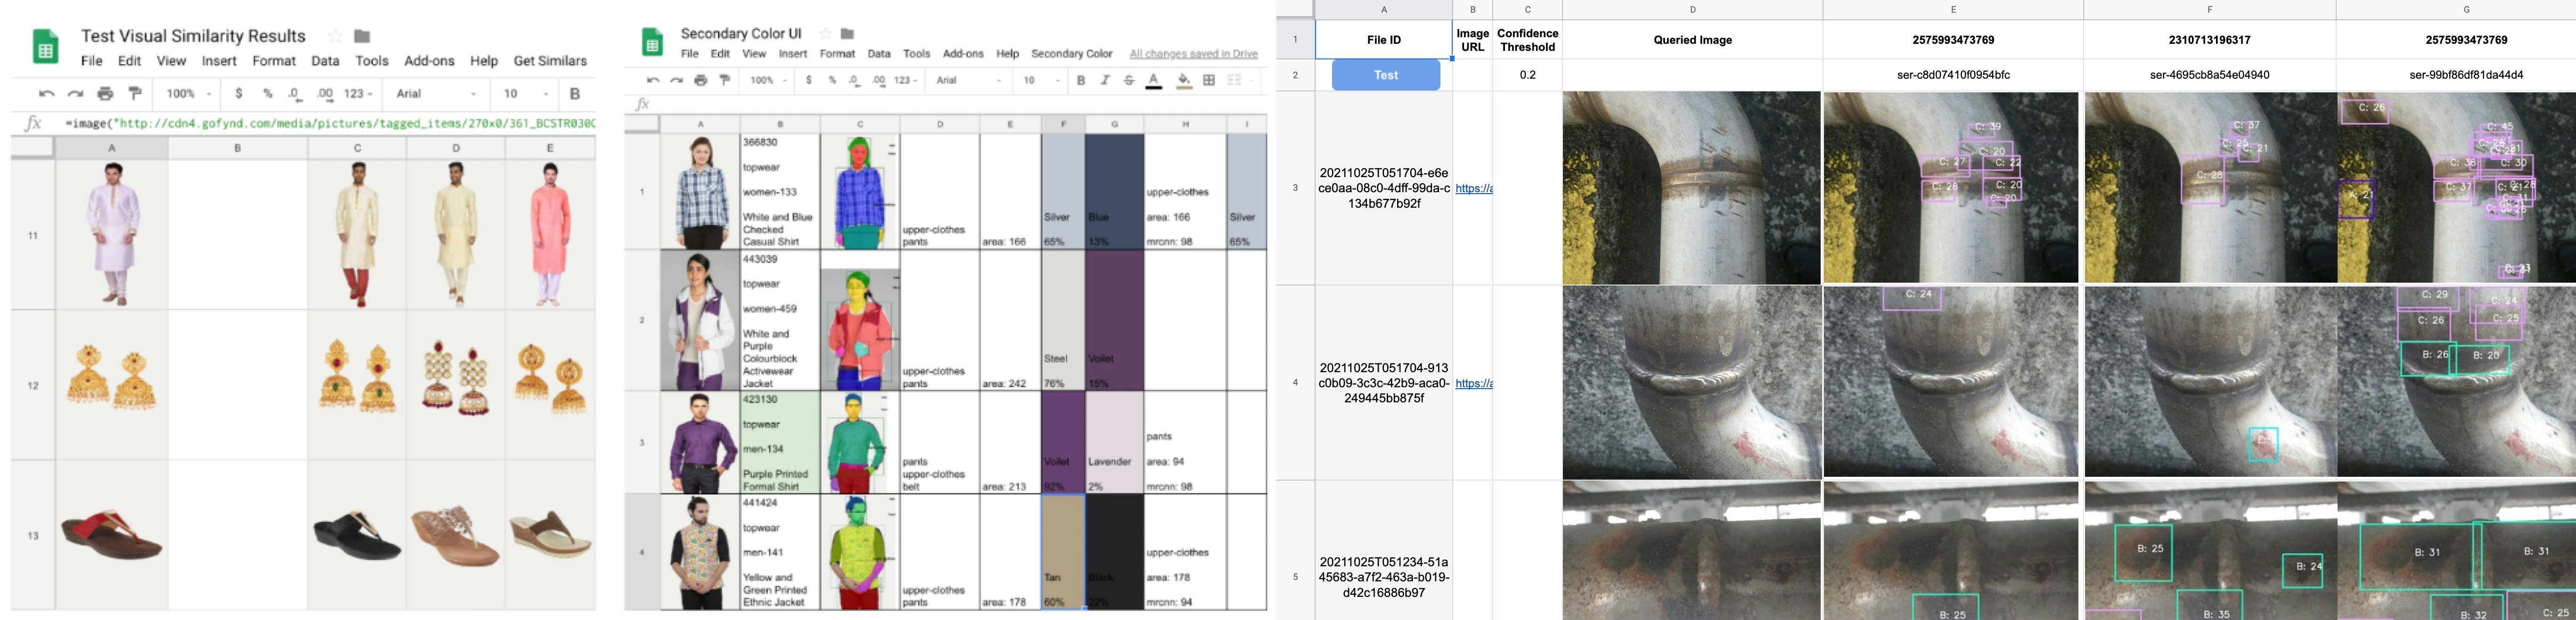
- An UI to view and compare annotations and results on random test data for my OD models. On pressing the
Testbutton (see the image below), 10 random samples are displayed. Another sheet is used to try different confidence thresholds to select one. Another sheet to test models from different experiments. I served all these models as an HTTP service on Abeja Platform and used those API to fetch data. Checkout our awesome API specs (https://api-spec.abeja.io/) - My personal tracker alerts me of changes happening on certain sites. You can easily fetch HTML DOM of any site using
UrlFetchApp.fetch(url).getContentText(). Then make a rule to send yourself a mail notifying the changes in one-liner:MailApp.sendEmail(recipient, subject, body). I have tracked products on the ecommerce sites to come back in stock. I have tracked changes in border reinforcement policy from various docs online. I even have a sheet that tells which of the docomo cycle stands nearby my home currently have available cycles. It did required doingInspectand understanding their APIs in theNetworksection ("over-engineering"). - Annotation UI to annotate boundary pixel for the transition from one color to another. It's a long story why it would be needed, but if you're curious you can read this interesting article on colors: https://blog.xkcd.com/2010/05/03/color-survey-results/.
- Inventory management app for my family business.
Other Tips
-
Be prompt to try open-source tools and repos. For this, I love using
Google Colab. This creates a nice bug-less, reproducible and sharable entry-point to these amazing toolkits (plus definitely free compute). It also makes you more comfortable understanding the repo and concerned research. You can easily try them on your data as connecting to Google Drive or Google Cloud Storage is one-liners. Or just upload your data. -
Documenting your own repos on
Google Colabis also a good idea. Get your git token and you can easily clone your private repo (make sure not to share your token). It's also a good environment for debugging a GPU heavy script before putting your jobs on paid cloud GPUs. I have even created annotation tools for some of my projects using interactive graphs using theBokehlibrary. -
Quickly prototype your ideas and give them shape by learning to make simple web applications using
Flask. It's an amazing framework to start making web apps as it starts with a simple core functionality that can be extended for a big production application. The boilerplate code is a few liners. Save the below file and runpython app.pywill start a server and if you openhttp://127.0.0.1:5000/add-by-10?text=flaskon your browser you will see the output asThe model output is 5displayed.app.pyfrom flask import Flask, request app = Flask(__name__) model = lambda a : len(a) # load your model here @app.route('/add-by-10') def add_by_10(): text = request.args.get('text') # get query params passed by user (what comes after "?" in url) output = model(text) # infer your model return f"The model output is {output}" # return output if __name__ == '__main__': app.run()You can easily take it forward and create data-driven HTML+CSS+JS web pages using
Jinja2templating. For creating an entire product, you can slowly add more components. Like you can add authentication layers (usingFlask-Login). AddCeleryto run background tasks. Connect with a database likeMongoDB(https://pythonbasics.org/flask-mongodb/). If you're diving deep, you can follow these tutorials (https://blog.miguelgrinberg.com/post/the-flask-mega-tutorial-part-i-hello-world). -
If you're expecting a lot of requests on your server, I will recommend switching to
FastAPIrather thanFlask, which have similar APIs but is much faster and have good support for documentation and data validation. -
Scraping the data: This becomes really easy having a basic understanding of HTML and CSS. Inspecting a web page on Chrome is fun and give a lot of power. For example, if you're using Chrome browser, right-click and click
Inspect. Go toConsoletab and execute this command:document.body.style.margin="100px". This will add margin to the current page you're viewing. In the same manner, you can play around websites, close cookie pop-ups and read the underlying texts hidden behind the subscribe form in some blogging sites. On python, you can then usebeatifulsoup4to parse a website and find elements. Let's have a hands-on by extracting the Google logo URL from their site. Install beautifulsoup4 usingpip install bs4and run the following scripts onipython:import requests from bs4 import BeautifulSoup soup = BeautifulSoup(requests.get("https://www.google.com/").text, "html.parser") print(f'Image url for Google Logo is: https://www.google.com{soup.find("img")["src"]}')
Quite easy right? Same way you can find elements by ids or name or classes and extract the information and save it as a json. But sometimes we need to click on elements or scroll to load more data on the page. In those cases, you need to use packages like `Scrapy` or `Selenium`. One easy alternate is using [Webscraper.io](https://webscraper.io/tutorials) chrome extension which made it quite easier by giving all this power on the UI. Watch the video tutorials in the previous link and I think you will love it (I did). For my case, I got the sitemap for my scraping requirement from the chrome extension and then used it in nodejs (they have a package for nodejs `web-scraper-headless`) to quickly scrap all the data I needed.

    Lastly, I would suggest that first and foremost to check if the website is using json based APIs or returning the HTML. In the previous case, it's much better and quicker to understand the APIs and just use python requests to fetch all the data. Just keep a `time.sleep` in your code if you're using multiprocessing, so that you won't overwhelm their servers. To check the APIs, click right on Chrome, select `Inspect`, go to the `Network` tab and open the page you're interested in. APIs should be listed in `Fetch/XHR` subsection.

:::note warn
Kindly note few of these tools are easy to solve a certain short term scripting requirement usually a Data Scientist faces. For a long term production project, there are more complex but reliable and recommended tools to do the same task.
:::

# End Notes
I have talked about several tools in this blog. I could only scratch the surface for them for the brevity of this post, but kindly comment if you face issues onboarding them. I hope this post will encourage you onboard yourself and to treat them more like a helping toolkit, instead of heavy concepts. Anyways, regularly learning and updating our knowledge base is a crucial thing for us Data Scientists. So learning to use these tools should be a piece of cake for you guys. Keep practicing! :wink: