Kerasなど使ってると下記の様なログを表示できると思います。
60000/60000 [==============================] - 1s 12us/step - loss: 0.7861 - acc: 0.7946 - val_loss: 0.3773 - val_acc: 0.8960
Epoch 2/30
60000/60000 [==============================] - 0s 8us/step - loss: 0.3267 - acc: 0.9061 - val_loss: 0.2846 - val_acc: 0.9125
Epoch 3/30
60000/60000 [==============================] - 1s 9us/step - loss: 0.2583 - acc: 0.9252 - val_loss: 0.2226 - val_acc: 0.9350
・・・省略
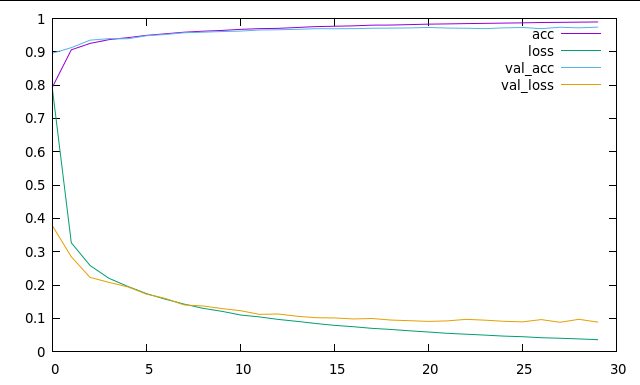
このデータを元にグラフを描けるワンライナーを作成しました。
~~そもそもmatplotlibで書けばよいし、TensorBoard使えば良いし、Excelなどで集計しても良い気もしますが…~~~
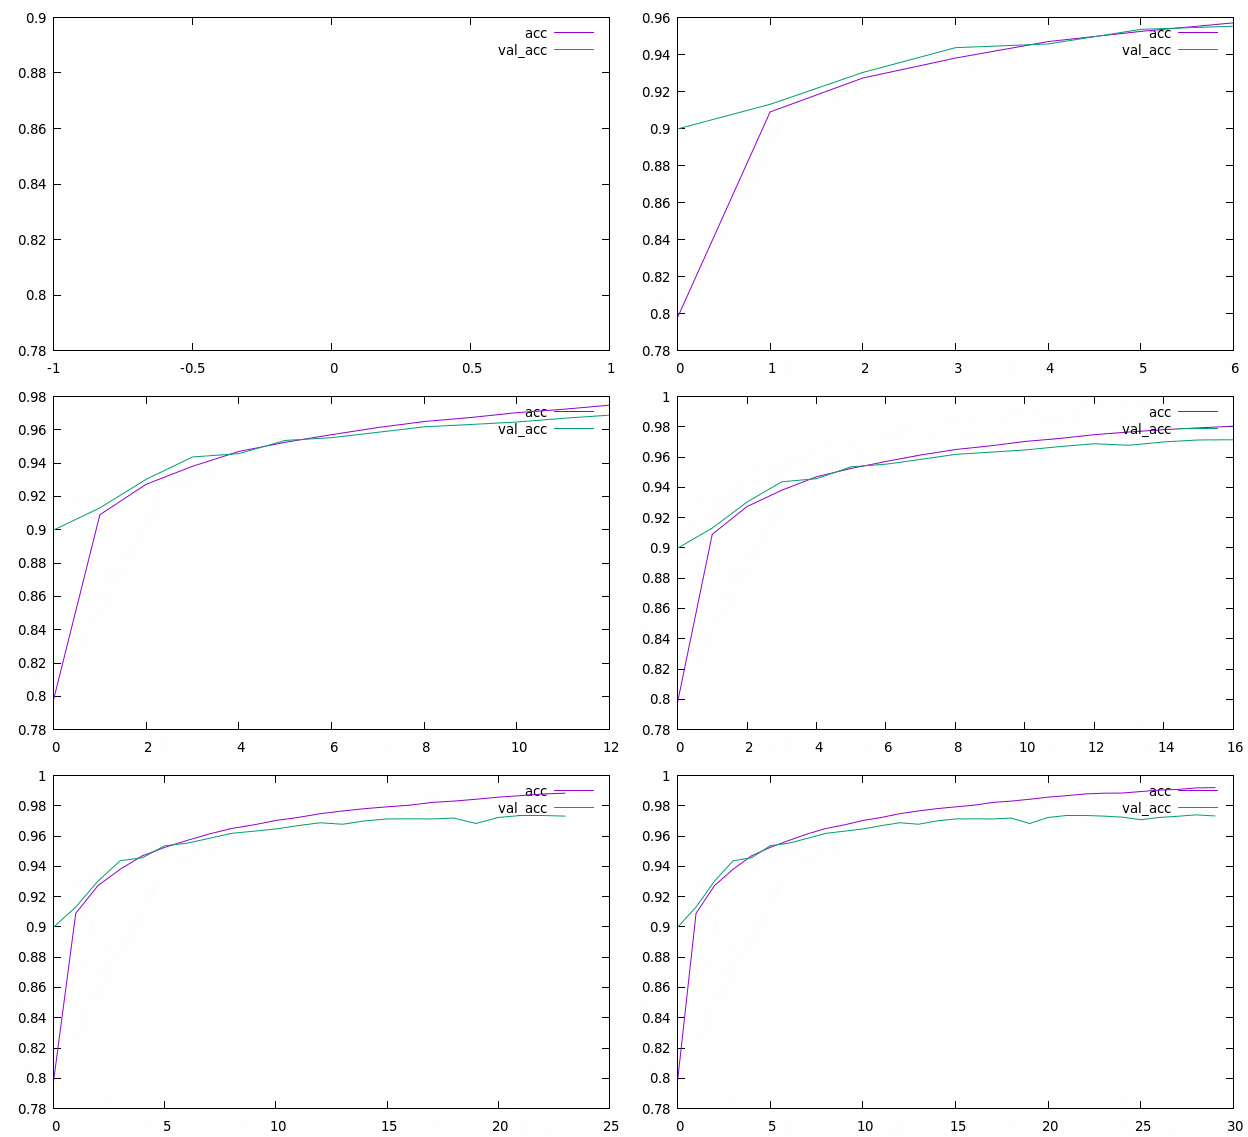
動的にグラフを描画することもできます。
ワンライナーでグラフを書く
標準出力に吐かれたログ(model.fit()のverbose=1)を、
result.logに保存して下記のコードを実行します。
$ cat result.log | egrep -o ' [_a-z:]+ [.0-9]+' | sort -s -t: -k1,1 | tac | awk 'a!=$1{print "e";a=$1;s=$1" "s}{print $2}END{print "plot "s}' | tac | sed -r "1s/([^ ]+):/'-' w l title '\1',/g;1s/_/\\\\_/g;1s/..$//"| gnuplot -p
特定のパラメータのみ描画する
特定のパラメータのみ描画したい場合は、2つ目のパイプのあとにgrepを追加するだけで実現できます。
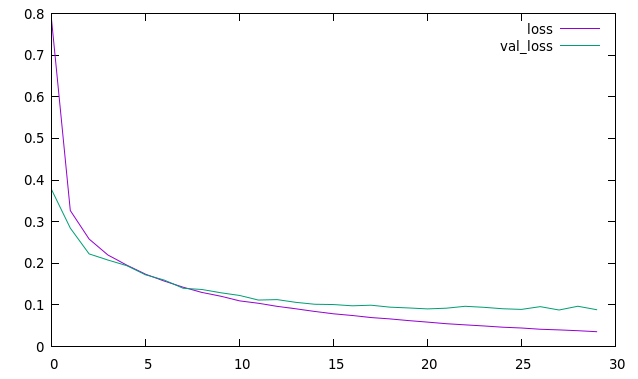
lossとval_lossだけ描画したいとき
$ cat result.log | egrep -o ' [_a-z:]+ [.0-9]+' | grep acc | sort -s -t: -k1,1 | tac | awk 'a!=$1{print "e";a=$1;s=$1" "s}{print $2}END{print "plot "s}' | tac | sed -r "1s/([^ ]+):/'-' w l title '\1',/g;1s/_/\\\\_/g;1s/..$//"| gnuplot -p
他のパラメータ
grep lossになっている場所をgrep accやgrep val、grep -v valなどにすれば様々なパラメータのグラフを描けます
動的に学習結果のグラフを描画する
上のワンライナーを少し編集することで、動的にグラフを描画することができます。
たとえば正当率のみ動的に取得したい場合のコードは下記です。
## まず下記を実行
$ g(){ cat result.log | grep step| egrep -o ' [_a-z:]+ [.0-9]+' | grep acc | sort -s -t: -k1,1 | tac | awk 'a!=$1{print "e";a=$1;s=$1" "s}{print $2}END{print "plot "s}' | tac | sed -r "1s/([^ ]+):/'-' w l title '\1',/g;1s/_/\\\\_/g;1s/..$//"; };while :; do sleep 0.5;g ;done|cat|gnuplot
別のプロセスでログを出力しつつ、gnuplotで読み込むためにファイルに書き込みます。
## 別タブでkerasのコードを実行します。
$ python test.py | tee result.log

Epoch 1/30

 1000/60000 [..............................] - ETA: 11s - loss: 2.3656 - acc: 0.1170
 7000/60000 [==>...........................] - ETA: 1s - loss: 1.9002 - acc: 0.4570
13000/60000 [=====>........................] - ETA: 1s - loss: 1.5913 - acc: 0.5748
19000/60000 [========>.....................] - ETA: 0s - loss: 1.3691 - acc: 0.6479
25000/60000 [===========>..................] - ETA: 0s - loss: 1.2127 - acc: 0.6909
28000/60000 [=============>................] - ETA: 0s - loss: 1.1491 - acc: 0.7079
34000/60000 [================>.............] - ETA: 0s - loss: 1.0472 - acc: 0.7341
40000/60000 [===================>..........] - ETA: 0s - loss: 0.9663 - acc: 0.7541
47000/60000 [======================>.......] - ETA: 0s - loss: 0.8928 - acc: 0.7725
54000/60000 [==========================>...] - ETA: 0s - loss: 0.8310 - acc: 0.7876
60000/60000 [==============================] - 1s 16us/step - loss: 0.7873 - acc: 0.7978 - val_loss: 0.3624 - val_acc: 0.8998
Epoch 2/30
・・・省略
トップのgifと同じ出力が得られます。
動いてて楽しい!
ただ「;」とか使っているので、ワンライナーとはいえない気もしますが
少し修正すれば、darknet の出力結果などにも対応できるので捗ると思います。
参考


