はじめに
開発環境の Rails サーバの処理時間を手軽に可視化する方法として、ActiveSupport::Notifications を使ってサーバの処理速度を計測し、Server Timing を使って可視化するという方法を紹介します。
対象読者
- Rails を利用している
- Chrome などの検証ツールを使っている
- サーバの処理速度を手軽に計測 & 可視化したいと思っている
出来上がるもの
Chrome の検証ツールから対象となる通信を選択して、Timing のタブを選択すると以下の図のように Server Timing を表示できるようになります。
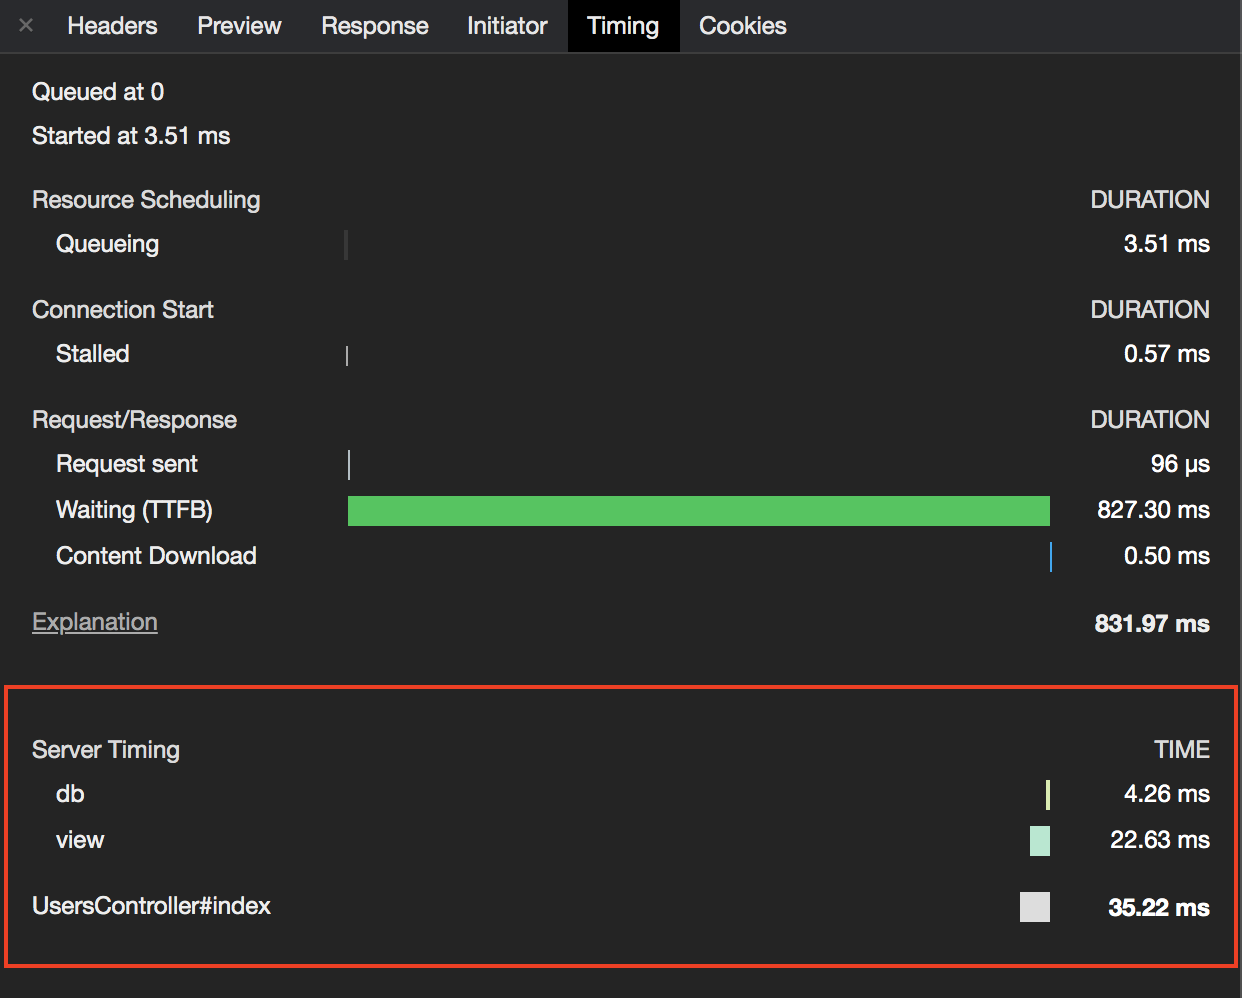
これは、データベースクエリの処理に 4.26ms、ビューの構築に 22.63ms、UserController#index として合計 35.22ms かかったことを表しています。
ActiveSupport::Notifications とは
Ruby 用の計測 API を提供してくれるライブラリです。
イベントの計測と計測結果を購読する仕組みが用意されており、このような感じで簡単に利用することができます。
# 購読
ActiveSupport::Notifications.subscribe("my.event") do |name, start, finish, id, payload|
  name    # => イベント名: "my.event"
  start   # => 計測開始時刻: 2020-10-18 12:34:56 +0900
  finish  # => 計測終了時刻: 2020-10-18 12:34:56 +0900
  id      # => ユニークなイベントのID: "xxxxxxxxxxxxx"
  payload # => ペイロード・追加情報(ハッシュ): {data: :hoge}
end

# 計測
ActiveSupport::Notifications.instrument("my.event", data: :hoge) do
  # イベントを実行
end
Server Timing とは
サーバ側の処理時間をHTTPヘッダを通して通信する仕組みです。
レスポンスヘッダの Server-Timing ヘッダフィールドに計測時間などの情報を付け加えることで、検証ツールが自動的に可視化してくれます。
記法
- 基本形:
名前;desc=説明文;dur=計測時間 - 計測時間の総計を表すときには、名前を
totalにする - 複数ある場合は、カンマで区切る
組み合わせる
まずは、サーバの処理時間を計測する必要があるのですが、実は Rails ではすでにその計測が process_action.action_controller という名前で行われています。ですので、購読する部分から作成すれば良いです。
config/initializer に以下のようなファイルを作成します。
ActiveSupport::Notifications.subscribe "process_action.action_controller" do |*args|
  # ActiveSupport::Notifications::Event は引数をそのまま受け渡すと、いい感じにデータを加工してくれます
  event = ActiveSupport::Notifications::Event.new(*args)

  duration = event.duration   # 処理時間
  payload = event.payload     # ペイロード

  controller_name = payload.controller # コントローラ名
  action_name = payload.action         # アクション名
  db_runtime = payload.db_runtime      # データベースへのクエリ実行にかかった時間
  view_runtime = payload.view_runtime  # ビューにかかった合計時間
  server_timing = "total;desc=\"#{controller_name}\##{action_name}\";dur=#{duration}, " \
           "db;dur=#{db_runtime}" \
           "view;dur=#{view_runtime}"
end
"process_action.action_controller" のペイロードの内容は以下に記載されています。
https://railsguides.jp/active_support_instrumentation.html#process-action-action-controller
これで、サーバでの処理時間の取得が完了しました。
あとは、Server-Timingヘッダに server_timing を登録するのみです。
Rails ではあまりグローバル変数は使わないですが、他に良い方法を知らないので今回はグローバル変数を使います。コントローラから取得できる response オブジェクトをグローバル変数に格納し、先ほどの購読処理の中で response オブジェクトに Server-Timingヘッダ を付け加えます。
class ApplicationController < ActionController::Base
  prepend_before_action { $response = response }
end
ActiveSupport::Notifications.subscribe "process_action.action_controller" do |*args|
  # ...
  # 省略
  # ...
  response = $response
  response.headers["Server-Timing"] = server_timing
end
実装は以上です。
これで Server-Timing ヘッダフィールドに以下のような値が付与され、Chromeの検証ツールがいい感じに可視化してくれるようになります。
Server-Timing: total;desc="UsersController#index";dur=17.167, db;dur=0.5440000677481294, view;dur=15.272999997250736
最後に
私自身、ActiveSupport::Notifications も Server Timing も初めて利用しましたが、簡単にサーバのどこで時間がかかっているのかを可視化でき、便利だなと思いました。ActiveSupport::Notifications は、他にも ActiveRecord で作成されたインスタンス数や SQL でキャッシュが利用されたかなどもわかるので、工夫次第ではより詳細な情報を知ることができます。また、機会があれば詳細情報も可視化してみたいと思います。