実行環境
- python :3.9.0
- matplotlib : 3.4.1
- japanize-matplotlib : 1.1.3
サンプルコード
Matplotlibにて折れ線グラフを作成する際に、使いたいパターンに近いコードがあったら便利かと思い作成。
pyplotとaxesでメソッド名が違うものがあり置き換えるのが面倒なので、axesのAPIを使用した例で記載。
axasのAPIの詳細は以下参照
https://matplotlib.org/stable/api/axes_api.html
折れ線グラフ:デフォルト表示
import matplotlib.pyplot as plt

# データセット: 東京の平均気温
x = [ 1, 2, 3, 4, 5, 6, 7, 8, 9, 10, 11, 12]
y1 = [7.1, 8.3, 10.7, 12.8, 19.5, 23.2, 24.3, 29.1, 24.2, 17.5, 14.0, 7.7]  # 2020年
y2 = [5.6, 7.2, 10.6, 13.6, 20.0, 21.8, 24.1, 28.4, 25.1, 19.4, 13.1, 8.5]  # 2019年
y3 = [4.7, 5.4, 11.5, 17.0, 19.8, 22.4, 28.3, 28.1, 22.9, 19.1, 14.0, 8.3]  # 2018年

# 折れ線グラフを作成
flg = plt.figure()
ax = flg.add_subplot()
ax.plot(x, y1)
ax.plot(x, y2)
ax.plot(x, y3)
# 画像ファイルに出力
flg.savefig('Matplotlib_LineChart_01.png')
-
Axes.plotメソッドで折れ線グラフ作成
表示したいデータのX配列、Y配列を渡して呼び出す
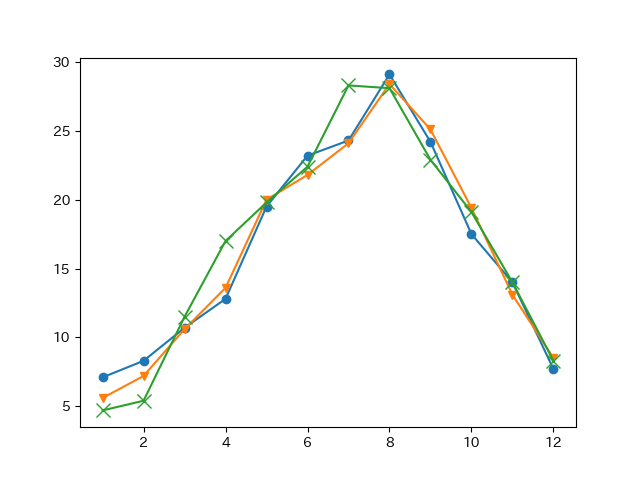
折れ線グラフ:マーカー指定
import matplotlib.pyplot as plt

# データセット: 東京の平均気温
x = [ 1, 2, 3, 4, 5, 6, 7, 8, 9, 10, 11, 12]
y1 = [7.1, 8.3, 10.7, 12.8, 19.5, 23.2, 24.3, 29.1, 24.2, 17.5, 14.0, 7.7]  # 2020年
y2 = [5.6, 7.2, 10.6, 13.6, 20.0, 21.8, 24.1, 28.4, 25.1, 19.4, 13.1, 8.5]  # 2019年
y3 = [4.7, 5.4, 11.5, 17.0, 19.8, 22.4, 28.3, 28.1, 22.9, 19.1, 14.0, 8.3]  # 2018年

# 折れ線グラフを作成 (マーカーを指定)
flg = plt.figure()
ax = flg.add_subplot()
ax.plot(x, y1, marker='o')  # ●マーカー
ax.plot(x, y2, marker='v')  # ▼マーカー
ax.plot(x, y3, marker='x', markersize=10)  # xマーカー
# 画像ファイルに出力
flg.savefig('Matplotlib_LineChart_02.png')
-
Axes.plotメソッドの
merkerパラメータでマーカーを設定可能 -
merkerで指定できるパラメータは、matplotlib.markersを参照 -
markeredgecolor(マーカー縁の色)、markeredgewidth(マーカー縁の太さ)、markerfacecolor(マーカーの色)、markersize(マーカーのサイズ)のパラメータが変更可能
折れ線グラフ:ラインスタイル指定
import matplotlib.pyplot as plt

# データセット: 東京の平均気温
x = [ 1, 2, 3, 4, 5, 6, 7, 8, 9, 10, 11, 12]
y1 = [7.1, 8.3, 10.7, 12.8, 19.5, 23.2, 24.3, 29.1, 24.2, 17.5, 14.0, 7.7]  # 2020年
y2 = [5.6, 7.2, 10.6, 13.6, 20.0, 21.8, 24.1, 28.4, 25.1, 19.4, 13.1, 8.5]  # 2019年
y3 = [4.7, 5.4, 11.5, 17.0, 19.8, 22.4, 28.3, 28.1, 22.9, 19.1, 14.0, 8.3]  # 2018年

# 折れ線グラフを作成 (ラインスタイルを指定)
flg = plt.figure()
ax = flg.add_subplot()
ax.plot(x, y1, linestyle='dashed')      # 破線
ax.plot(x, y2, linestyle='dashdot')     # 一点鎖線
ax.plot(x, y3, linestyle='dotted')      # 点線
# 画像ファイルに出力
flg.savefig('Matplotlib_LineChart_03.png')
-
Axes.plotメソッドの
linestyleパラメータでラインスタイルを設定可能 -
linestyleで指定できるパラメータは、matplotlib.lines.Line2D.set_linestyleを参照
折れ線グラフ:ライン太さ変更
import matplotlib.pyplot as plt

# データセット: 東京の平均気温
x = [ 1, 2, 3, 4, 5, 6, 7, 8, 9, 10, 11, 12]
y1 = [7.1, 8.3, 10.7, 12.8, 19.5, 23.2, 24.3, 29.1, 24.2, 17.5, 14.0, 7.7]  # 2020年
y2 = [5.6, 7.2, 10.6, 13.6, 20.0, 21.8, 24.1, 28.4, 25.1, 19.4, 13.1, 8.5]  # 2019年
y3 = [4.7, 5.4, 11.5, 17.0, 19.8, 22.4, 28.3, 28.1, 22.9, 19.1, 14.0, 8.3]  # 2018年

# 折れ線グラフを作成 (ライン太さを指定)
flg = plt.figure()
ax = flg.add_subplot()
ax.plot(x, y1, linewidth=0.5)
ax.plot(x, y2, linewidth=2)
ax.plot(x, y3, linewidth=4)
# 画像ファイルに出力
flg.savefig('Matplotlib_LineChart_04.png')
-
Axes.plotメソッドの
linewidthパラメータでライン太さを設定可能
折れ線グラフ:ライン色指定
import matplotlib.pyplot as plt

# データセット: 東京の平均気温
x = [ 1, 2, 3, 4, 5, 6, 7, 8, 9, 10, 11, 12]
y1 = [7.1, 8.3, 10.7, 12.8, 19.5, 23.2, 24.3, 29.1, 24.2, 17.5, 14.0, 7.7]  # 2020年
y2 = [5.6, 7.2, 10.6, 13.6, 20.0, 21.8, 24.1, 28.4, 25.1, 19.4, 13.1, 8.5]  # 2019年
y3 = [4.7, 5.4, 11.5, 17.0, 19.8, 22.4, 28.3, 28.1, 22.9, 19.1, 14.0, 8.3]  # 2018年

# 折れ線グラフを作成 (色を指定)
flg = plt.figure()
ax = flg.add_subplot()
ax.plot(x, y1, color='r')       # Base ColorのRを指定
ax.plot(x, y2, color='pink')    # CSS Colorのpinkを指定
ax.plot(x, y3, color='#9a0eea') # カラーコード指定
# 画像ファイルに出力
flg.savefig('Matplotlib_LineChart_05.png')
-
Axes.plotメソッドの
colorパラメータでライン太さを設定可能
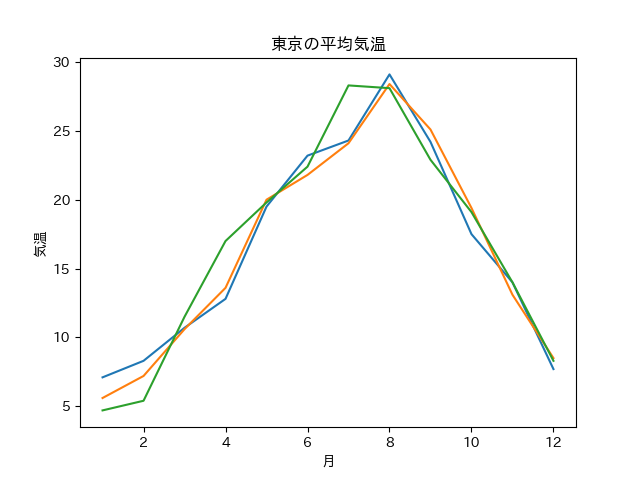
折れ線グラフ:グラフタイトル、軸ラベル追加
import matplotlib.pyplot as plt
import japanize_matplotlib      # 日本語を表示したい場合のみimport

# データセット: 東京の平均気温
x = [ 1, 2, 3, 4, 5, 6, 7, 8, 9, 10, 11, 12]
y1 = [7.1, 8.3, 10.7, 12.8, 19.5, 23.2, 24.3, 29.1, 24.2, 17.5, 14.0, 7.7]  # 2020年
y2 = [5.6, 7.2, 10.6, 13.6, 20.0, 21.8, 24.1, 28.4, 25.1, 19.4, 13.1, 8.5]  # 2019年
y3 = [4.7, 5.4, 11.5, 17.0, 19.8, 22.4, 28.3, 28.1, 22.9, 19.1, 14.0, 8.3]  # 2018年

# 折れ線グラフを作成 (タイトル、X軸/Y軸のラベル追加)
flg = plt.figure()
ax = flg.add_subplot()
ax.set_title('東京の平均気温')  # グラフタイトル追加
ax.set_xlabel('月')             # X軸のラベル
ax.set_ylabel('気温')           # Y軸のラベル
ax.plot(x, y1)
ax.plot(x, y2)
ax.plot(x, y3)
# 画像ファイルに出力
flg.savefig('Matplotlib_LineChart_06.png')
- タイトルやラベルなどで日本語表示したい場合は
japanize_matplotlibをimport。(やらないと文字化けする) - Axes.set_titleメソッドでグラフタイトルを追加
- Axes.set_xlabelメソッドでX軸ラベルを追加
- Axes.set_ylabelメソッドでY軸ラベルを追加
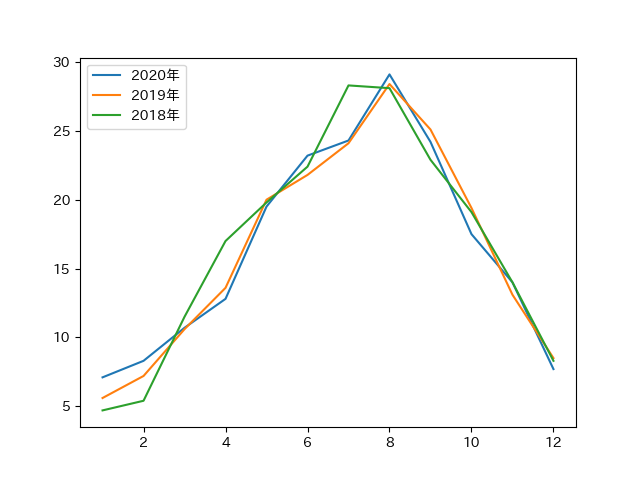
折れ線グラフ:凡例追加
import matplotlib.pyplot as plt

# データセット: 東京の平均気温
x = [ 1, 2, 3, 4, 5, 6, 7, 8, 9, 10, 11, 12]
y1 = [7.1, 8.3, 10.7, 12.8, 19.5, 23.2, 24.3, 29.1, 24.2, 17.5, 14.0, 7.7]  # 2020年
y2 = [5.6, 7.2, 10.6, 13.6, 20.0, 21.8, 24.1, 28.4, 25.1, 19.4, 13.1, 8.5]  # 2019年
y3 = [4.7, 5.4, 11.5, 17.0, 19.8, 22.4, 28.3, 28.1, 22.9, 19.1, 14.0, 8.3]  # 2018年

# 折れ線グラフを作成 (凡例の追加)
flg = plt.figure()
ax = flg.add_subplot()
ax.plot(x, y1, label='2020年')  # ラベルに'2020年'を指定
ax.plot(x, y2, label='2019年')  # ラベルに'2019年'を指定
ax.plot(x, y3, label='2018年')  # ラベルに'2018年'を指定
ax.legend(loc='upper left')     # 凡例の表示:左上に表示
# 画像ファイルに出力
flg.savefig('Matplotlib_LineChart_07.png')
- Axes.legendメソッドで凡例を表示
-
locパラメータで凡例の表示位置を指定可能
折れ線グラフ:軸範囲の指定
import matplotlib.pyplot as plt

# データセット: 東京の平均気温
x = [ 1, 2, 3, 4, 5, 6, 7, 8, 9, 10, 11, 12]
y1 = [7.1, 8.3, 10.7, 12.8, 19.5, 23.2, 24.3, 29.1, 24.2, 17.5, 14.0, 7.7]  # 2020年
y2 = [5.6, 7.2, 10.6, 13.6, 20.0, 21.8, 24.1, 28.4, 25.1, 19.4, 13.1, 8.5]  # 2019年
y3 = [4.7, 5.4, 11.5, 17.0, 19.8, 22.4, 28.3, 28.1, 22.9, 19.1, 14.0, 8.3]  # 2018年

# 折れ線グラフを作成 (軸範囲の指定)
flg = plt.figure()
ax = flg.add_subplot()
ax.set_xlim(1, 12)      # X軸範囲を   1~12 に指定
ax.set_ylim(-10, 50)    # Y軸範囲を -10~50 に指定
ax.plot(x, y1)
ax.plot(x, y2)
ax.plot(x, y3)
# 画像ファイルに出力
flg.savefig('Matplotlib_LineChart_08.png')
- Axes.set_xlimメソッドでX軸の表示範囲を指定
- Axes.set_ylimメソッドでY軸の表示範囲を指定
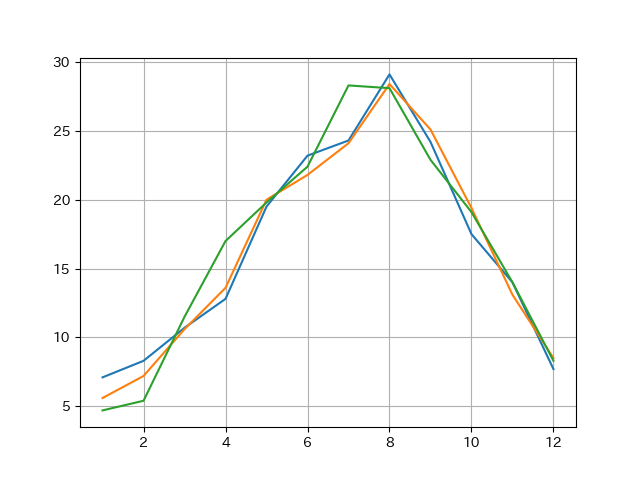
折れ線グラフ:グリッド線の表示(デフォルト表示)
import matplotlib.pyplot as plt

# データセット: 東京の平均気温
x = [ 1, 2, 3, 4, 5, 6, 7, 8, 9, 10, 11, 12]
y1 = [7.1, 8.3, 10.7, 12.8, 19.5, 23.2, 24.3, 29.1, 24.2, 17.5, 14.0, 7.7]  # 2020年
y2 = [5.6, 7.2, 10.6, 13.6, 20.0, 21.8, 24.1, 28.4, 25.1, 19.4, 13.1, 8.5]  # 2019年
y3 = [4.7, 5.4, 11.5, 17.0, 19.8, 22.4, 28.3, 28.1, 22.9, 19.1, 14.0, 8.3]  # 2018年

# 折れ線グラフを作成 (グリッド線の表示:デフォルト)
flg = plt.figure()
ax = flg.add_subplot()
ax.grid()           # グリッド線の表示(デフォルト表示)
ax.plot(x, y1)
ax.plot(x, y2)
ax.plot(x, y3)
# 画像ファイルに出力
flg.savefig('Matplotlib_LineChart_09.png')
- Axes.gridメソッドでグリッド線を表示
- パラメータを指定がなければ、X主軸とY主軸のグリッド線を表示
折れ線グラフ:グリッド線の表示(詳細指定)
import matplotlib.pyplot as plt

# データセット: 東京の平均気温
x = [ 1, 2, 3, 4, 5, 6, 7, 8, 9, 10, 11, 12]
y1 = [7.1, 8.3, 10.7, 12.8, 19.5, 23.2, 24.3, 29.1, 24.2, 17.5, 14.0, 7.7]  # 2020年
y2 = [5.6, 7.2, 10.6, 13.6, 20.0, 21.8, 24.1, 28.4, 25.1, 19.4, 13.1, 8.5]  # 2019年
y3 = [4.7, 5.4, 11.5, 17.0, 19.8, 22.4, 28.3, 28.1, 22.9, 19.1, 14.0, 8.3]  # 2018年

# 折れ線グラフを作成 (グリッド線の表示:詳細指定)
flg = plt.figure()
ax = flg.add_subplot()
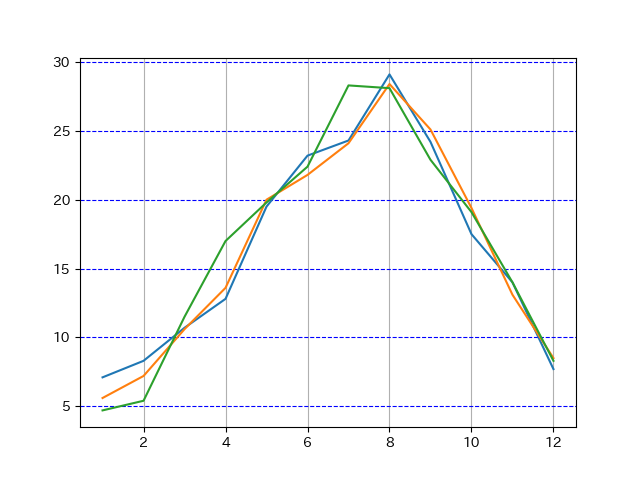
ax.grid(axis='x')   # グリッド線の表示:X軸
ax.grid(axis='y', linestyle='dashed', color='blue')   # グリッド線の表示:Y軸(点線)
ax.plot(x, y1)
ax.plot(x, y2)
ax.plot(x, y3)
# 画像ファイルに出力
flg.savefig('Matplotlib_LineChart_09a.png')
- Axes.gridメソッドでグリッド線を表示
-
axis(軸)パラメータで表示対象の、X軸、Y軸、両方(both) の指定が可能 -
linestyle、linewidth、colorなどパラメータでグリッド線の詳細を指定が可能
折れ線グラフ:目盛り指定、目盛り文字指定
import matplotlib.pyplot as plt
import japanize_matplotlib      # 日本語を表示したい場合のみimport

# データセット: 東京の平均気温
x = [ 1, 2, 3, 4, 5, 6, 7, 8, 9, 10, 11, 12]
y1 = [7.1, 8.3, 10.7, 12.8, 19.5, 23.2, 24.3, 29.1, 24.2, 17.5, 14.0, 7.7]  # 2020年
y2 = [5.6, 7.2, 10.6, 13.6, 20.0, 21.8, 24.1, 28.4, 25.1, 19.4, 13.1, 8.5]  # 2019年
y3 = [4.7, 5.4, 11.5, 17.0, 19.8, 22.4, 28.3, 28.1, 22.9, 19.1, 14.0, 8.3]  # 2018年

# 折れ線グラフを作成 (軸目盛の指定、フォーマット指定)
flg = plt.figure()
ax = flg.add_subplot()
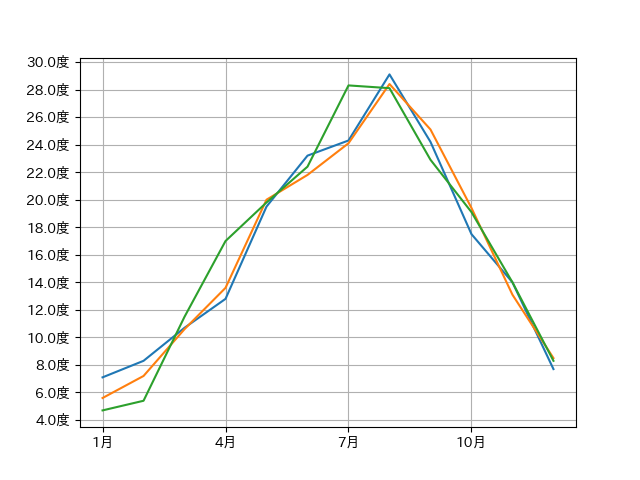
ax.set_xticks( [1, 4, 7, 10] )                  # X軸の目盛指定。4点指定
ax.set_xticklabels( ['1月','4月','7月','10月']) # X軸の表示テキスト指定。4点指定
ax.set_yticks( range(0, 51, 2) )                # Y軸の目盛指定。0~50まで2区切り
ax.yaxis.set_major_formatter('{x:.1f}度')       # Y軸の目盛表示フォーマットの指定
ax.grid()       # グリッド線の表示(デフォルト表示)
ax.plot(x, y1)
ax.plot(x, y2)
ax.plot(x, y3)
# 画像ファイルに出力
flg.savefig('Matplotlib_LineChart_10.png')
- Axes.set_xticksメソッドでX軸の目盛の表示位置を指定(配列を指定)
- Axes.set_yticksメソッドでY軸の目盛を表示位置を指定(配列を指定)
- Axes.set_xticklabelsメソッドでX軸の目盛ラベルを指定(配列数を合わせる必要あり)
- Axis.set_major_formatterメソッドで、目盛に表示する文字のフォーマット指定
折れ線グラフ:軸目盛表示、補助目盛表示
import matplotlib.pyplot as plt
import japanize_matplotlib      # 日本語を表示したい場合のみimport

# データセット: 東京の平均気温
x = [ 1, 2, 3, 4, 5, 6, 7, 8, 9, 10, 11, 12]
y1 = [7.1, 8.3, 10.7, 12.8, 19.5, 23.2, 24.3, 29.1, 24.2, 17.5, 14.0, 7.7]  # 2020年
y2 = [5.6, 7.2, 10.6, 13.6, 20.0, 21.8, 24.1, 28.4, 25.1, 19.4, 13.1, 8.5]  # 2019年
y3 = [4.7, 5.4, 11.5, 17.0, 19.8, 22.4, 28.3, 28.1, 22.9, 19.1, 14.0, 8.3]  # 2018年

# 折れ線グラフを作成 (軸目盛表示、補助目盛表示)
flg = plt.figure()
ax = flg.add_subplot()
ax.minorticks_on()  # 補助目盛を有効化(set_xticks、set_yticksより先に呼出が必要)
ax.set_xticks( [1, 4, 7, 10], minor=False)      # X軸の主目盛の指定(4点)
ax.set_xticks( range(1, 13, 1), minor=True)     # X軸の補助目盛の指定。1~12まで1区切り
ax.set_xticklabels( ['1月','4月','7月','10月']) # X軸の表示テキスト指定(4点)
ax.set_yticks( range(0, 51, 5), minor=False)    # Y軸の目盛の指定。0~50まで5区切り
ax.set_yticks( range(0, 51, 1), minor=True)     # Y軸の補助目盛の指定。0~50まで1区切り
ax.yaxis.set_major_formatter('{x:.1f}度')       # Y軸の目盛の表示フォーマットの指定
ax.grid()           # グリッド線の表示(デフォルト表示)
ax.grid(axis='x', which="minor", linestyle='dotted')    # グリッド線の表示:X軸補助目盛を点線
ax.plot(x, y1)
ax.plot(x, y2)
ax.plot(x, y3)
# 画像ファイルに出力
flg.savefig('Matplotlib_LineChart_10a.png')
-
Axes.minorticks_onメソッドで、補助目盛を有効化
Axes.set_xticksやAxes.set_yticksよりも前に呼び出しておく必要あり -
Axes.set_xticksメソッドで
minor=Falseを指定して、X軸の主目盛の表示位置を設定 -
Axes.set_xticksメソッドで
minor=Tureを指定して、X軸の補助目盛の表示位置を設定 -
Axes.set_yticksメソッドで
minor=Falseを指定して、Y軸の主目盛の表示位置を設定 -
Axes.set_yticksメソッドで
minor=Tureを指定して、Y軸の補助目盛の表示位置を設定 -
Axes.gridメソッドで
which='minor'を指定して、X軸補助目盛のグリッド線を表示
折れ線グラフ:水平線、垂直線の追加
import matplotlib.pyplot as plt

# データセット: 東京の平均気温
x = [ 1, 2, 3, 4, 5, 6, 7, 8, 9, 10, 11, 12]
y1 = [7.1, 8.3, 10.7, 12.8, 19.5, 23.2, 24.3, 29.1, 24.2, 17.5, 14.0, 7.7]  # 2020年
y2 = [5.6, 7.2, 10.6, 13.6, 20.0, 21.8, 24.1, 28.4, 25.1, 19.4, 13.1, 8.5]  # 2019年
y3 = [4.7, 5.4, 11.5, 17.0, 19.8, 22.4, 28.3, 28.1, 22.9, 19.1, 14.0, 8.3]  # 2018年

# 折れ線グラフを作成 (水平線を引く)
flg = plt.figure()
ax = flg.add_subplot()
ax.grid()       # グリッド線の表示
ax.axhline(y=25, color='red')           # 赤色の水平線をy=25に表示
ax.axvline(x=4, linestyle='dashed')     # 破線の垂直線をx=4に表示
ax.plot(x, y1)
ax.plot(x, y2)
ax.plot(x, y3)
# 画像ファイルに出力
flg.savefig('Matplotlib_LineChart_11.png')
- Axes.axhlineメソッドで水平線を表示
- Axes.axvlineメソッドで垂直線を表示
- それぞれ
color、linestyle、linewidthなどのパラメータで表示形式を設定可能

