PythonでPyAudio、NumPyを使って
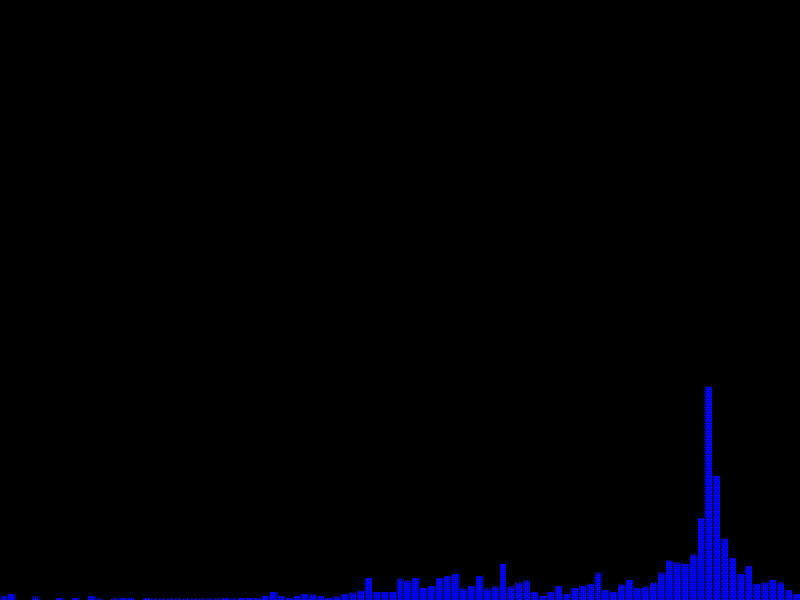
マイクから拾った音をリアルタイムでオーディオスペクトラム表示するものを作ってみました。
実行例
動作確認環境
- Python : 3.8.10
- NumPy : 1.21.1
- PyAudio :0.2.11
- opencv-python : 4.5.3.56
Windows10環境だと、PyAudioをインストールしようとして
pip install pyaudio をしても失敗するので、以下を参考にセットアップ
実装内容について
処理の流れとしては以下のような感じのをループで繰り返しています。
- PyAudioを使ってマイクからサンプリングした音声データを取得
- NumPyのFFT(高速フーリエ変換)を使って、音声データを周波数成分を取得
- 周波数成分の値を範囲毎に合計して、表示用データを作成する
- OpenCV使って結果を表示
ソースコード
import pyaudio
import numpy as np
import cv2

SAMPLE_RATE = 44100             # サンプリングレート
FRAME_SIZE = 2048               # フレームサイズ
INT16_MAX = 32767               # サンプリングデータ正規化用
SAMPLING_SIZE = FRAME_SIZE * 4  # サンプリング配列サイズ
WIDTH = 800     # 表示領域の幅
HEIGHT = 600    # 表示領域の高さ

# 周波数成分を表示用配列に変換する用の行列(spectram_array)作成
#   FFT結果(周波数成分の配列)から、どの要素を合計するかをまとめた行列
spectram_range = [int(22050 / 2 ** (i/10)) for i in range(100, -1,-1)]    # 21Hz~22,050Hzの間を分割
freq = np.abs(np.fft.fftfreq(SAMPLING_SIZE, d=(1/SAMPLE_RATE)))  # サンプル周波数を取得
spectram_array = (freq <= spectram_range[0]).reshape(1,-1)
for index in range(1, len(spectram_range)):
    tmp_freq = ((freq > spectram_range[index - 1]) & (freq <= spectram_range[index])).reshape(1,-1)
    spectram_array = np.append(spectram_array, tmp_freq, axis=0)

# 表示用の変数定義・初期化
part_w = WIDTH / len(spectram_range)
part_h = HEIGHT / 100
img = np.full((HEIGHT, WIDTH, 3), 0, dtype=np.uint8)

# マイク サンプリング開始
audio = pyaudio.PyAudio()
stream = audio.open(format=pyaudio.paInt16, channels=1, rate=SAMPLE_RATE,
                    input=True, input_device_index=1, frames_per_buffer=FRAME_SIZE)

# サンプリング配列(sampling_data)の初期化
sampling_data = np.zeros(SAMPLING_SIZE)
while True:
    # フレームサイズ分データを読み込み
    frame = stream.read(FRAME_SIZE)
    # サンプリング配列に読み込んだデータを追加
    frame_data = np.frombuffer(frame, dtype="int16") / INT16_MAX
    sampling_data = np.concatenate([sampling_data, frame_data])
    if sampling_data.shape[0] > SAMPLING_SIZE:
        # サンプリング配列サイズよりあふれた部分をカット
        sampling_data = sampling_data[sampling_data.shape[0] - SAMPLING_SIZE:]

    # 高速フーリエ変換(周波数成分に変換)
    fft = np.abs(np.fft.fft(sampling_data))

    # 表示用データ配列作成
    #   周波数成分の値を周波数を範囲毎に合計して、表示用データ配列(spectram_data)を作成
    spectram_data = np.dot(spectram_array, fft)

    # 出力処理
    cv2.rectangle(img, (0,0), (WIDTH, HEIGHT), (0,0,0), thickness=-1)   # 出力領域のクリア
    for index, value in enumerate(spectram_data):
        # 単色のグラフとして表示
        cv2.rectangle(img,
                      (int(part_w * (index + 0) + 1), int(HEIGHT)),
                      (int(part_w * (index + 1) - 1), int(max(HEIGHT - value/4, 0))),
                      (255, 0, 0), thickness=-1)
    # 画面表示
    cv2.imshow("Microphone Test", img)

    # 終了キーチェック
    key = cv2.waitKey(1) & 0xFF
    if key == ord('q') or key == ord('Q') or key == 0x1b:
        break

# マイク サンプリング終了処理
stream.stop_stream()
stream.close()
audio.terminate()
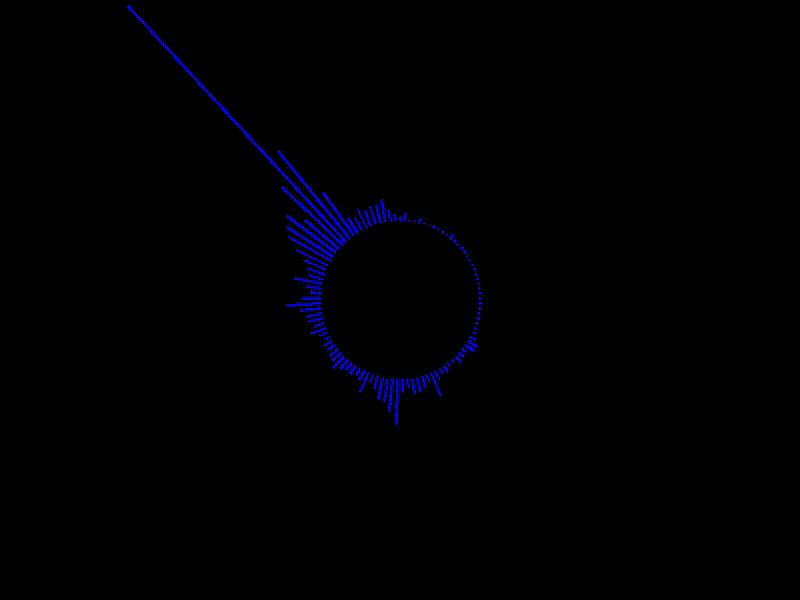
おまけ
かなりやっつけですが、出力処理の部分をちょっと細工して、円状に線を引くように変更すると
動画とかでよく見るようなオーディオスペクトラムの形に
    # 出力処理
    cv2.rectangle(img, (0,0), (WIDTH, HEIGHT), (0,0,0), thickness=-1)   # 出力領域のクリア
    for index, value in enumerate(spectram_data):
        # 単色のグラフとして表示
        rad = (2 * np.pi) * (index / len(spectram_data))
        x1 = int(WIDTH / 2 + np.sin(rad) * 80)
        y1 = int(HEIGHT / 2 - np.cos(rad) * 80)
        rad = (2 * np.pi) * (index / len(spectram_data))
        x2 = int(WIDTH / 2 + np.sin(rad) * (80 + value/4))
        y2 = int(HEIGHT / 2 - np.cos(rad) * (80 + value/4))
        cv2.line(img, (x1, y1), (x2, y2), (255, 0, 0), thickness=2)
    # 画面表示
    cv2.imshow("Microphone Test", img)