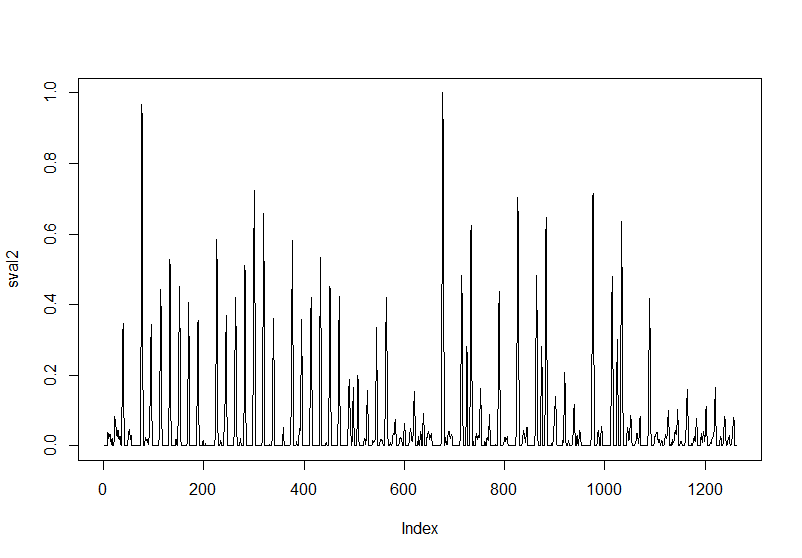
先日こんなつぶやきを投稿した。
こういうピークをうまく拾う良い方法ないかなあ pic.twitter.com/TQe87zwTiQ
— Akinori Ito (@akinori_ito) 2019年2月13日
よく考えたら去年自分で書いてたわ。以下解説。
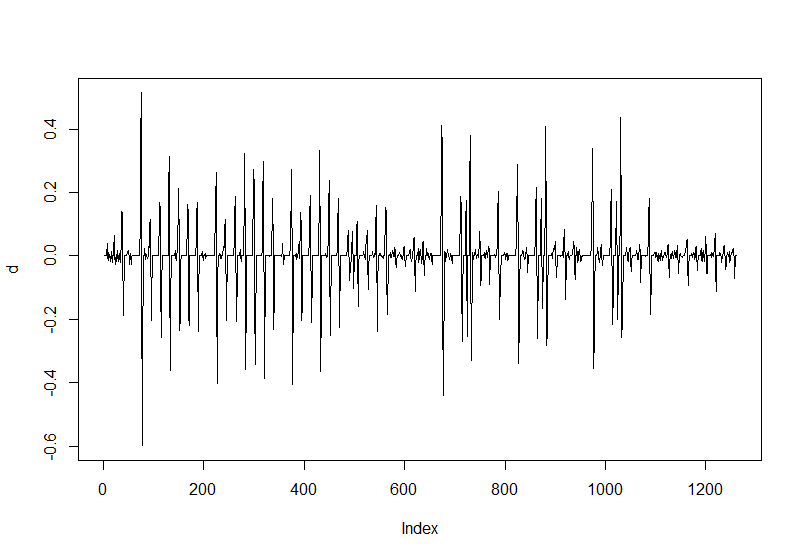
ある点がピークだということは、ピークが極大の場合、その点の前後の点はピーク点の値より小さい(極小の場合はその逆)のはず。そこで、データx[1..n]に対して、d[i]=x[i]-x[i-1]を計算する。

このグラフで値が0になっている点がピークのはずだ。
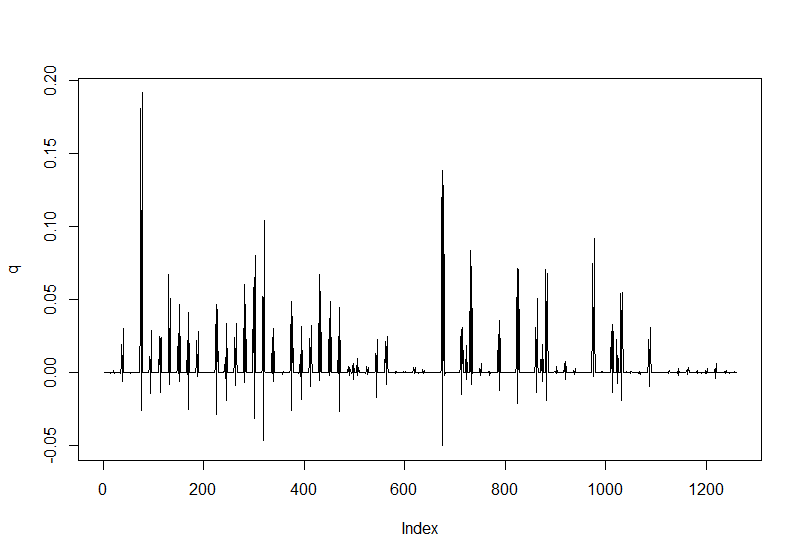
次にq[i]=d[i]*d[i-1]を計算する。こんな感じになる。

値が負になっている点は、隣り合う2点の符号が異なっている点なので、この点の前後でdが0交差していることがわかる。そこで、値が負の点だけを拾ってくれば、それがピークになっている。
実際にはどんなピークを拾ってもよいわけではないので、ピークの値にしきい値を設けたり、大きいピークから順番に拾って、その周囲の一定範囲にあるピークは拾わないなどの細かい処理を行う。
コードはこんな感じ。
detect.peaks <- function(res,thres,pwidth,type="min") {
  len <- length(res)
  if (type == "min") {
    res[res>thres] <- thres
  } else {
    res[res<thres] <- thres
  }
  dif <- res[2:len]-res[1:len-1]
  ddif <- dif[2:(len-1)]*dif[1:(len-2)]
  ppos <- c()
  while (TRUE) {
    p <- which.min(ddif)
    if (ddif[p] == 0) break
    if (length(ppos)>0) {
      q <- abs(ppos-p)
      if (min(q) > pwidth) {
        ppos <- c(ppos,p)
      }
    } else {
      ppos <- c(ppos,p)
    }
    ddif[p] <- 0
  }
  ppos+1
}
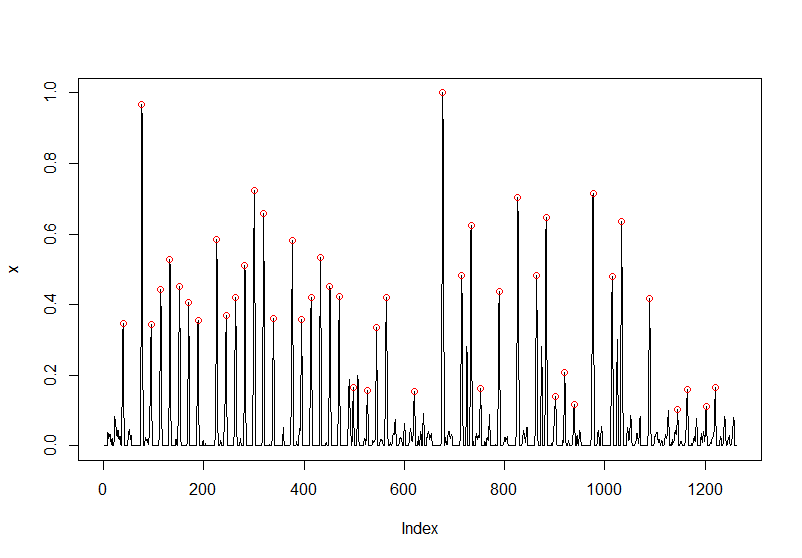
これで検出してみる。
p <- detect.peaks(x,0.1,10,"max")
追記
河原英紀先生からリプライをいただいた。
自分がMATLAB でよく使っている方法。例えば、こんなデータ:
— Hideki Kawahara (@hidekikawahara) 2019年2月15日
y = conv(hanning(50), randn(1000,1)) .^ 2;
ピークの場所を求め
base_id = 1:length(y);
peak_loc = base_id(y > y([1 1:end-1]) & y > y([2:end end]));
以下で、確認
figure;plot(y)
hold all;plot(peak_loc, y(peak_loc), 'o') https://t.co/oKgtPJR38w
ピーク点は単調増加かつ単調減少であるという性質を使った方法です。こっちの方がエレガントかも。

