いきなりまとめ
- scikit-learnのk-meansでクラスタリング
- クラスタリングをイジングモデルで表現する
- PyQUBO+Openjijでシミュレーテッドアニーリングを用いたクラスタリング
参考資料
クラスタリング問題とは?
クラスタリングとは、教師なし機械学習一つで、与えられたデータの集合をラベルなしにいくつかのクラスタリング(部分集合)へ分割することです。
データの準備
今回は明らかに分割できそうな、二次元平面上の点の集合をクラスタリングをしたいと思います。
次のように人工データを生成します。
# ライブラリをインポート
import numpy as np
import pandas as pd
from matplotlib import pyplot as plt

# 人工データの生成
data = []
for i in range(100): # 100個のデータを生成
    p = np.random.uniform(0, 1)
    cls =1 if p>0.5 else -1 #点の配置は平均の異なる2つのガウス分布のどちらかに従う。
    data.append(np.random.normal(0, 0.5, 2) + np.array([cls, cls]))

df1 = pd.DataFrame(data, columns=["x", "y"], index=range(len(data)))

# 可視化
df1.plot(kind='scatter', x="x", y="y")
plt.show()
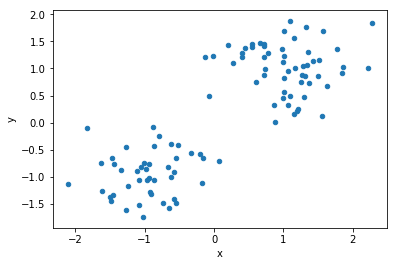
出力が以下のようになります。(作り方が作り方なので、バキバキに分割できそうですね。)
k-means(k平均法)での実装
クラスタリングの例として、scikit-learnを用いたクラスタリングをしてみましょう。アルゴリズム等の詳細は参考資料をご覧ください。
それでは、上で作った人工データに対してscikit learnのk-meansでクラスタリングをしてみましょう。
from sklearn import cluster
# クラスタリング自体は一行で書ける。
kmeans= cluster.KMeans(n_clusters=2).fit(df1)

# 結果を表示
# クラスターごとに色を変えます
for idx, label in enumerate(kmeans.labels_):
    if label:
        plt.scatter(df1.loc[idx]["x"], df1.loc[idx]["y"], color="b")
    else:
        plt.scatter(df1.loc[idx]["x"], df1.loc[idx]["y"], color="r")
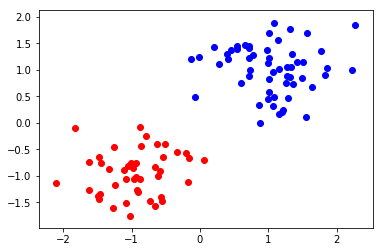
結果は以下のようになりました。

きれいにクラスタリングできていますね(人工データのでそれはそう。)
イジングモデルによるクラスタリングの表現
今回のクラスタリングのハミルトニアン(最適化したい関数)は以下のように書けます。
$$
H = -\sum_{i,j\in D} \frac{1}{2}d_{ij}(1 - \sigma_i \sigma_j)
$$
$D$はデータの集合, $\sigma_i$, $\sigma_j$はスピン変数(-1,1のどちらかを取る)、$d_{ij}$は点$i,j$同士の距離を表します。
上のハミルトニアンでは、スピン変数$\sigma_i$(-1もしくは1)がその点$i$が所属するクラスを表します。したがって、ハミルトニアンの各項は2つスピン変数が同じであれば0、異なっていればその2つの点同士その距離$d_{ij}$になります。
つまり、ハミルトニアンを最小にすることは、**「異なるクラスに所属する点同士の距離の和を最大化する」**ことに対応しています。
なお、イジングモデルでのクラスタリングの最適化関数は先のk-meansでの最適化関数と異なっています。
PyQUBO+Openjijでの実装
今回は、PyQUBOでハミルトニアンを作り、SAはOpenjijで計算します。
(なお、PyQUBOにもシミュレーテッドアニーリングのソルバーがあるので、そちらを使っても良いかもしれません。)
どちらも、pip installできるのでアニーリングアルゴリズムに興味がある方は、お手軽に量子アニーリングをシミュレーションをするSQA(simulated quantum annealing)が実行できて便利です。
今回は、pandasのDataFrameを渡すと、クラスタリングしたラベルを返す関数を実装します。
# ライブラリをインポート
from pyqubo import Array
import openjij as oj
from scipy.spatial import distance_matrix

# 関数を定義
def clustering_openjij(df):

    # 距離行列(d_ij)(各サンプル同士の距離を要素に持つ行列)を計算
    d_ij = distance_matrix(df, df)

    # spinを定義
    spin = Array.create("spin", shape= len(df), vartype="SPIN")

    # ハミルトニアンを定義
    H = - 0.5* sum(
        [d_ij[i,j]* (1 - spin[i]* spin[j]) for i in range(len(df)) for j in range(len(df))]
    )
    # ハミルトニアンをコンパイル
    model = H.compile()
    # コンパイルしたモデルをqubo化
    qubo, offset = model.to_qubo()
    # openjijのシミュレーテッド量子アニーリング(SQASampler)で解を求めたいので、サンプラーのインスタンス化
    sampler = oj.SQASampler(iteration=10, step_num=100)
    # 実際に解を求める
    response = sampler.sample_qubo(qubo)
    # pyquboのdecode_solutionを使いたいのでラベルと解を合わせて辞書化する。
    # openjijのsamplerではいくつか解が返ってくるので、response.energiesが最小のものを最適解として採用する。
    raw_solution = dict(zip(response.indices, response.states[np.argmin(response.energies)]))
    # pyquboのdecoded_solutionでデコードされた解、壊れたスピン、エネルギーを得る
    decoded_solution, broken, energy= model.decode_solution(raw_solution, vartype="SPIN")
    # 最終的にほしい各点ごとのラベルのリスト
    labels = [int(decoded_solution["spin"][idx] ) for idx  in range(len(df))]
    return labels,  sum(response.energies)
では、実際に解を求めてみましょう。
labels, energy =clustering_openjij(df1[["x", "y"]])
結果を確認してみましょう。
print(labels)
>> [0, 0, 0, 1, 0, 1, 0, 1, 1, 1, 0, 0, 0, 1, 1, 1, 0, 1, 1, 1, 1, 1, 0, 1, 1, 1, 1, 0, 0, 0, 1, 1, 1, 1, 1, 1, 0, 1, 1, 1, 1, 0, 1, 0, 1, 1, 1, 1, 1, 1, 1, 0, 1, 1, 0, 1, 1, 0, 0, 1, 1, 1, 0, 0, 0, 1, 1, 1, 0, 0, 0, 1, 1, 1, 0, 0, 0, 1, 0, 0, 1, 1, 0, 0, 0, 0, 0, 0, 0, 1, 0, 0, 0, 0, 0, 1, 1, 1, 0, 1]
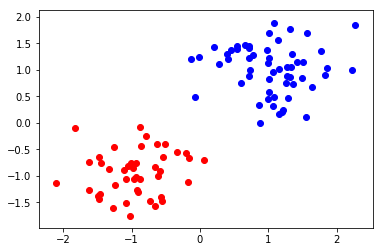
可視化をしましょう。
for idx, label in  enumerate(labels):
    if label:
        plt.scatter(df1.loc[idx]["x"], df1.loc[idx]["y"], color="b")
    else:
        plt.scatter(df1.loc[idx]["x"], df1.loc[idx]["y"], color="r")
まとめ(再掲)
今回は以下のことを行いました。
- 二次元平面上で人工データを生成する
- scikit-learnのk-meansでクラスタリング
- クラスタリングをイジングモデルで表現する
- PyQUBO+Openjijでシミュレーテッドアニーリングを用いたクラスタリング

