本記事ではimport matplotlib.pyplot as pltやfig = plt.figure()を前提にしています.
まとめ
Pythonで出力された図の目盛りラベルを取得するためには,
- plt.draw() で一旦図を確定
- locs, labs = plt.xticks() で目盛りを取得
- _labs = [ lab.get_text() for lab in labs ] で目盛りラベルの文字列を取得
- ~ラベル文字列の変更~
- plt.xticks( locs, _labs ) で図の目盛りを変更
という手順が必要です.
もしくは直接labsの要素を書き換えることでも編集できます(例:labs[0].set_va( 'top' ))
後者の方法の方が,文字列以外の編集も可能なため便利な場合もあります.
~以下解説~
目盛りの取得
目盛りの文字列が取得できないとき
Pythonがデフォルトで出力する目盛りを取得しても,ラベルの情報が含まれていない場合があります.
例えば
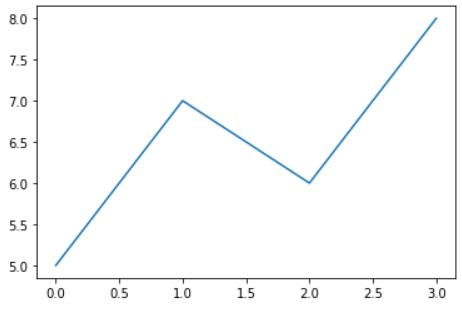
plt.plot( [ 5, 7, 6 ] )
を実行すると下の図が表示されますが,
この目盛りを取得しても,ラベルの情報は''になっています.なお,plt.xticks()の2つ目の返り値は文字列ではなく,matplotlib.text.Textオブジェクトのリストなので,.get_text()というメソッドで文字列を取得しています:
xlocs, xlabs = plt.xticks()
print( xlocs ) # [-0.5  0.   0.5  1.   1.5  2.   2.5  3.   3.5]
print( [ xlab.get_text() for xlab in xlabs ] ) # ['', '', '', '', '', '', '', '', '']

ylocs, ylabs = plt.xticks()
print( ylocs ) # [4.5 5.  5.5 6.  6.5 7.  7.5 8.  8.5]
print( [ ylab.get_text() for ylab in ylabs ] ) # ['', '', '', '', '', '', '', '', '']
更に言うと,今出力されている図の目盛りよりも上下左右に余分な目盛り(横軸の-0.5など)が含まれています.
これは,Python側が「目盛りは現在未確定で,以降も追加編集に応じて適宜調整します」という状態だからです.
stackoverflow: Getting empty tick labels before showing a plot in Matplotlib
図の確定→目盛り文字列の取得が可能に
従って図を一旦確定させるために,plt.draw()もしくはfig.canvas.draw()を行います.
すると,目盛りの文字列も確定するので,(表示される図は変わりませんが)図に表示されている文字列が取得できるようになります.
plt.plot( [ 5, 7, 6, 8 ] )
plt.draw()

xlocs, xlabs = plt.xticks()
print( xlocs ) # [-0.5  0.   0.5  1.   1.5  2.   2.5  3.   3.5]
print( [ xlab.get_text() for xlab in xlabs ] ) # ['−0.5', '0.0', '0.5', '1.0', '1.5', '2.0', '2.5', '3.0', '3.5']

ylocs, ylabs = plt.yticks()
print( ylocs ) # [4.5 5.  5.5 6.  6.5 7.  7.5 8.  8.5]
print( [ ylab.get_text() for ylab in ylabs ] )
# ['4.5', '5.0', '5.5', '6.0', '6.5', '7.0', '7.5', '8.0', '8.5']
目盛りラベルの更新
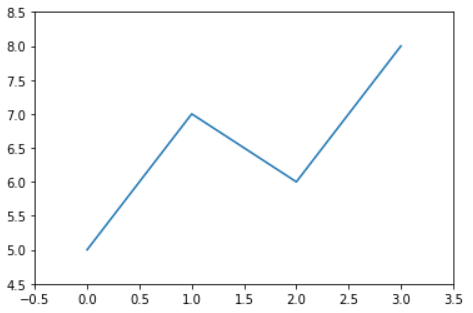
この段階でも上下左右の余分な目盛りが含まれているので,無編集でも再びplt.xticks( xlocs, xlabs )を行うと,余分な目盛りが表示されてしまうために図の余白が大きくなります:
plt.xticks( xlocs, xlabs )
plt.yticks( ylocs, ylabs )
従って図の範囲を変えたくない場合には,xlim(),ylim()で図の範囲を指定するか,目盛りのリストを適宜トリミング(例:xlocs[1:-1])する必要があります.
xmin, xmax = plt.xlim()
ymin, ymax = plt.ylim()
plt.xticks( xlocs, xlabs )
plt.yticks( ylocs, ylabs )
plt.xlim( xmin, xmax )
plt.ylim( ymin, ymax )
# === OR ===
plt.xticks( xlocs[1:-1], xlabs[1:-1] )
plt.yticks( ylocs[1:-1], ylabs[1:-1] )
matplotlib.text.Textクラスに直接アクセスする
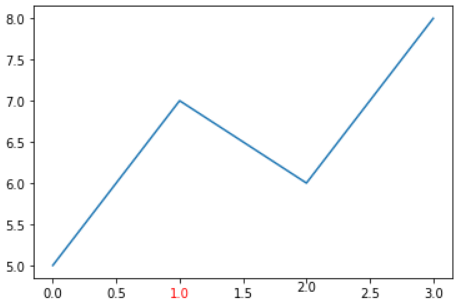
上では目盛りラベルの文字列を一旦取得しましたが,plt.xticks()で得られるmatplotlib.text.Textクラスに直接アクセスすることで,目盛りの体裁を1個ずつ編集することができます.
その編集には,下ページのメソッド一覧(set_*)を使います.例えば,
matplotlib公式: matplotlib.text.Text
xlocs, xlabs = plt.xticks()
xlabs[3].set_color( 'red' )
xlabs[5].set_va( 'center' )
これを活用すると,目盛りラベルが長くなってしまうときに,ラベルを互い違いに表示することもできます:
stackoverflow: Aligning rotated xticklabels with their respective xticks


